
In large-scale IoT deployments, communication between Edge and Cloud carries the critical importance, yet it often remains invisible. When data stops flowing, you have to deal with delays, lags, or even significant data loss! That’s why it’s crucial to know exactly what’s happening with the messages.
Imagine having a real-time health monitor for your entire IoT fleet. With the new uplink/downlink visibility feature in ThingsBoard 4.2 and ThingsBoard Edge 4.2, you no longer have to wonder if your data is getting through. You get real-time insight into communication between Edge and Cloud, as well as the confidence that your IoT data moves as expected, or an instant signal when it doesn’t.
Why This Matters
For IoT teams, visibility means control. With uplink and downlink monitoring, you can sproactively spot and resolve communication issues before they impact operations. The result? More reliable data flow, lower operational costs, and the confidence that your most critical data is always where it needs to be.
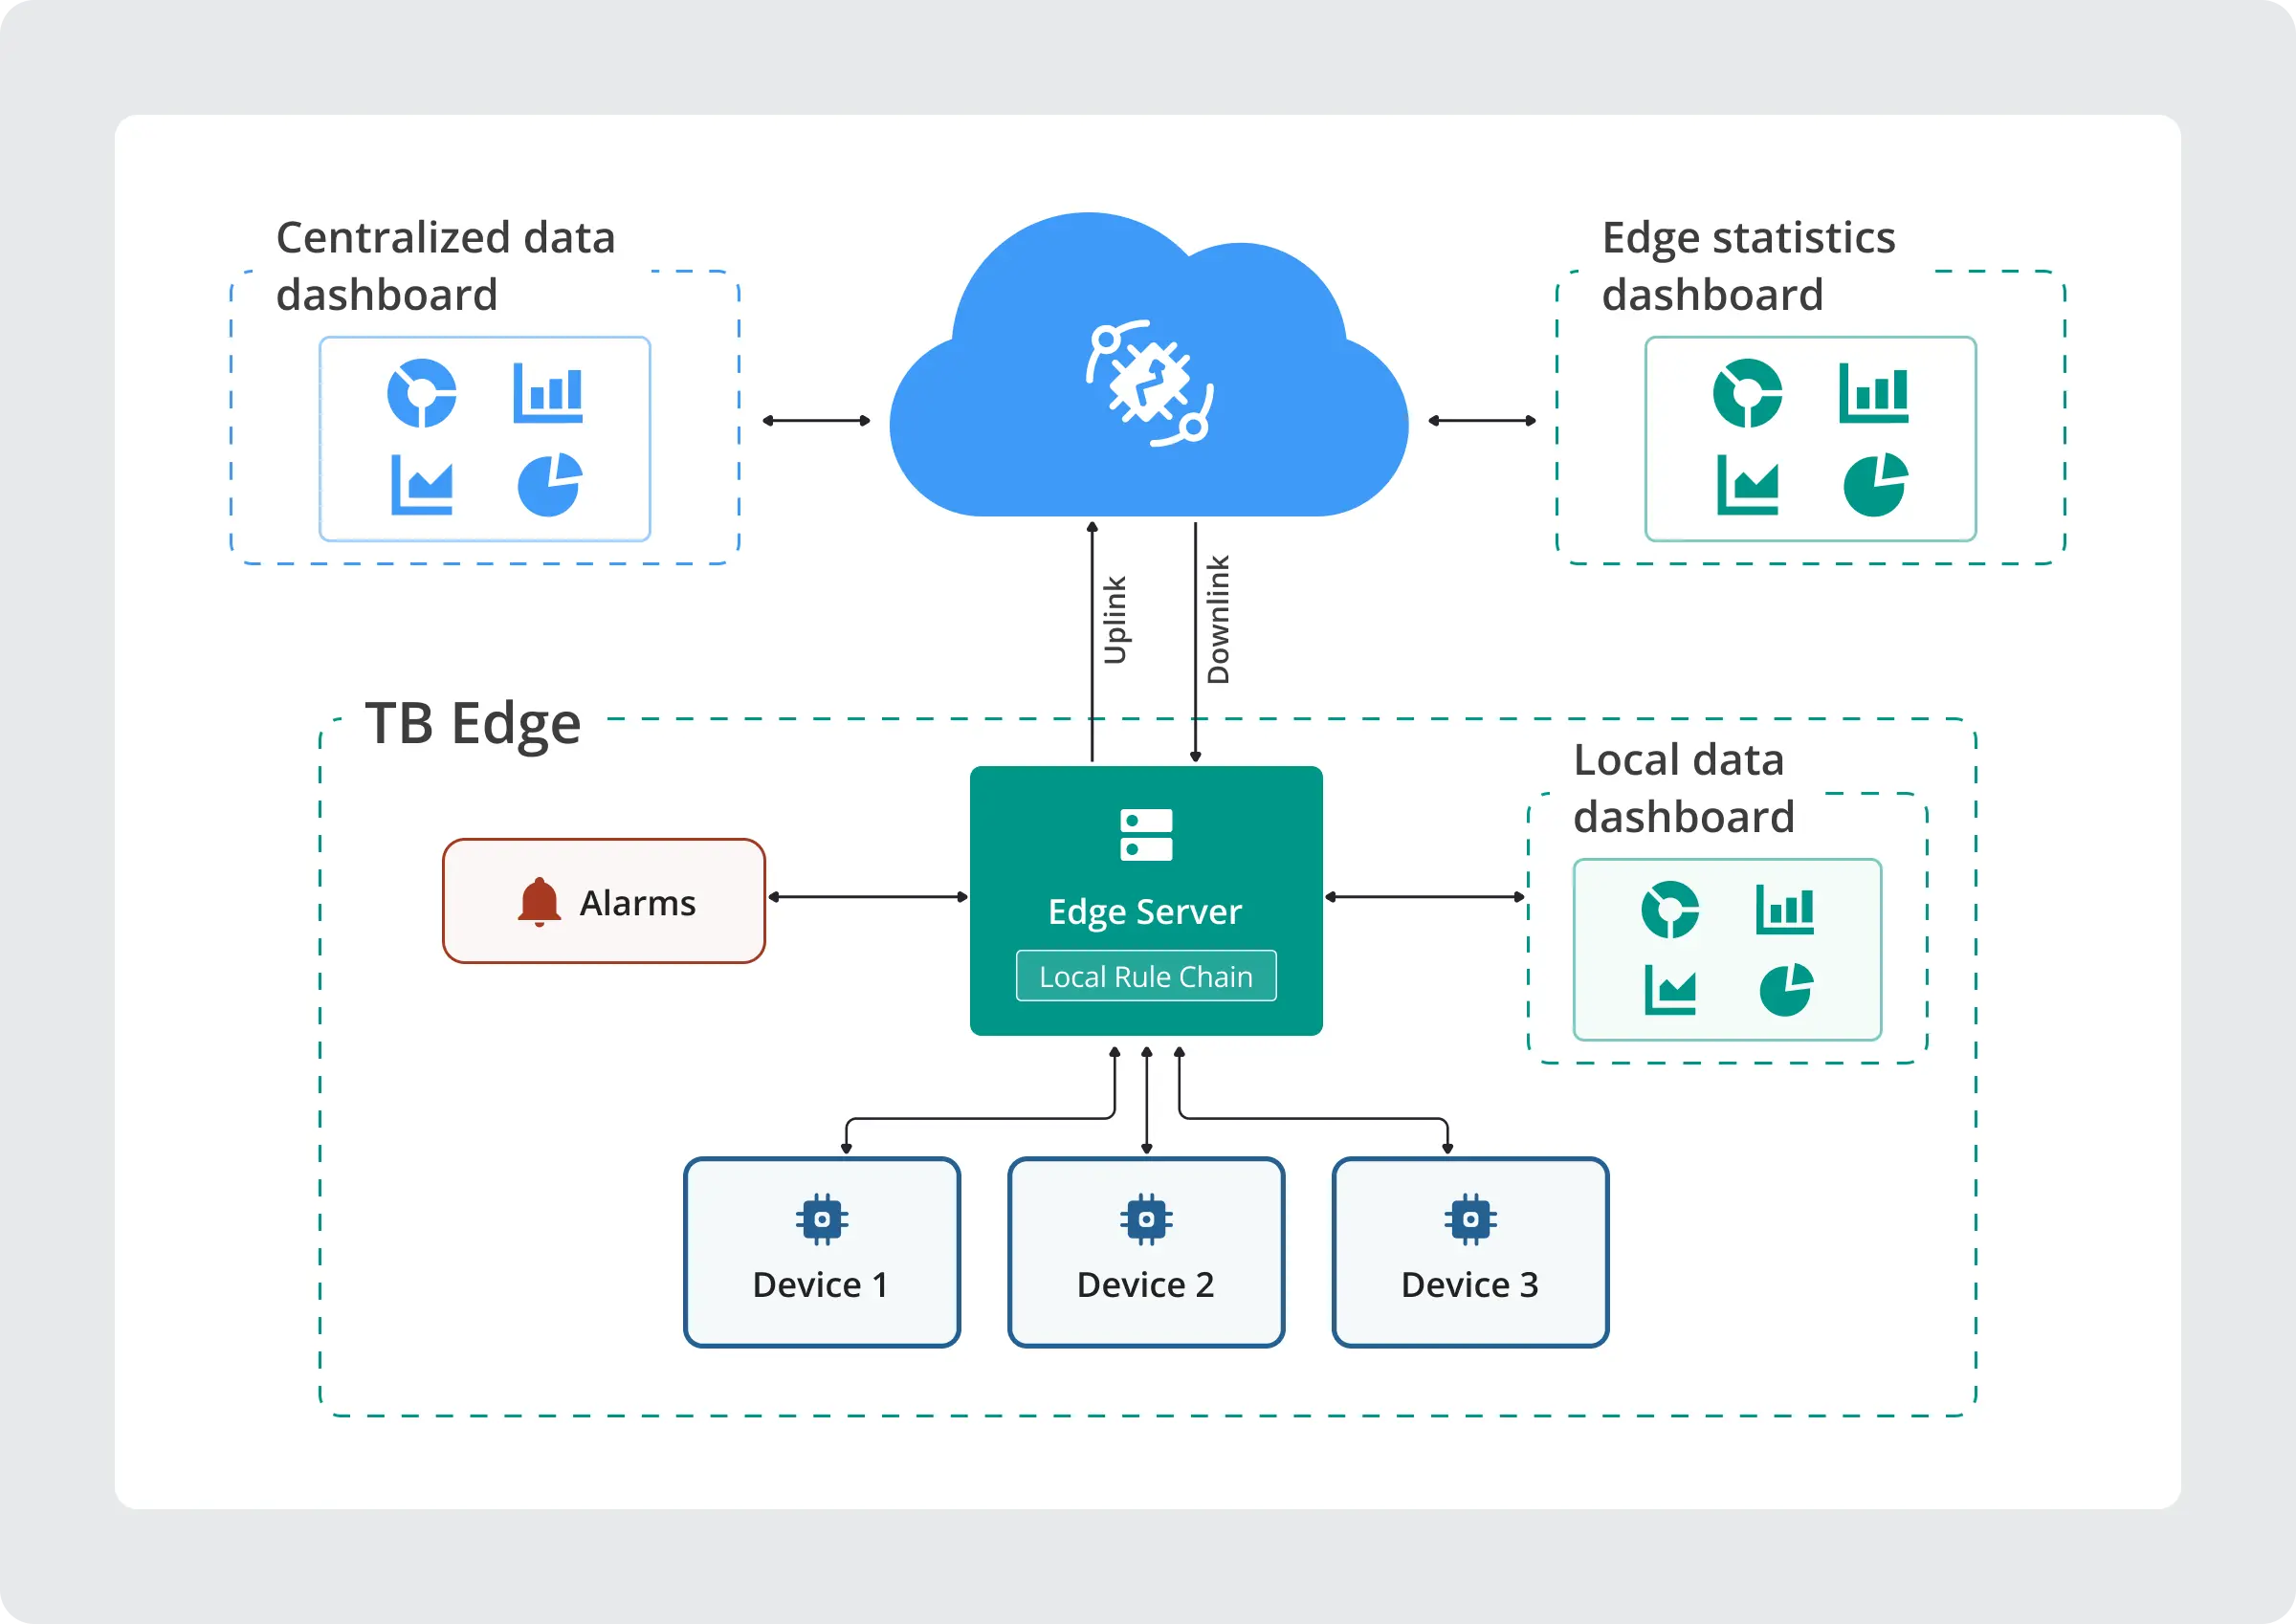
How This Works
ThingsBoard Edge collects and aggregates statistics on message traffic, publishing them as time-series data at a configurable interval (default is 10 minutes). These metrics cover both directions of traffic and help you quickly identify:
- Communication delays (e.g., queue growth, slow push rates),
- Metric lags (pending messages not yet sent),
- Message delivery trends, delays, and failures over time.
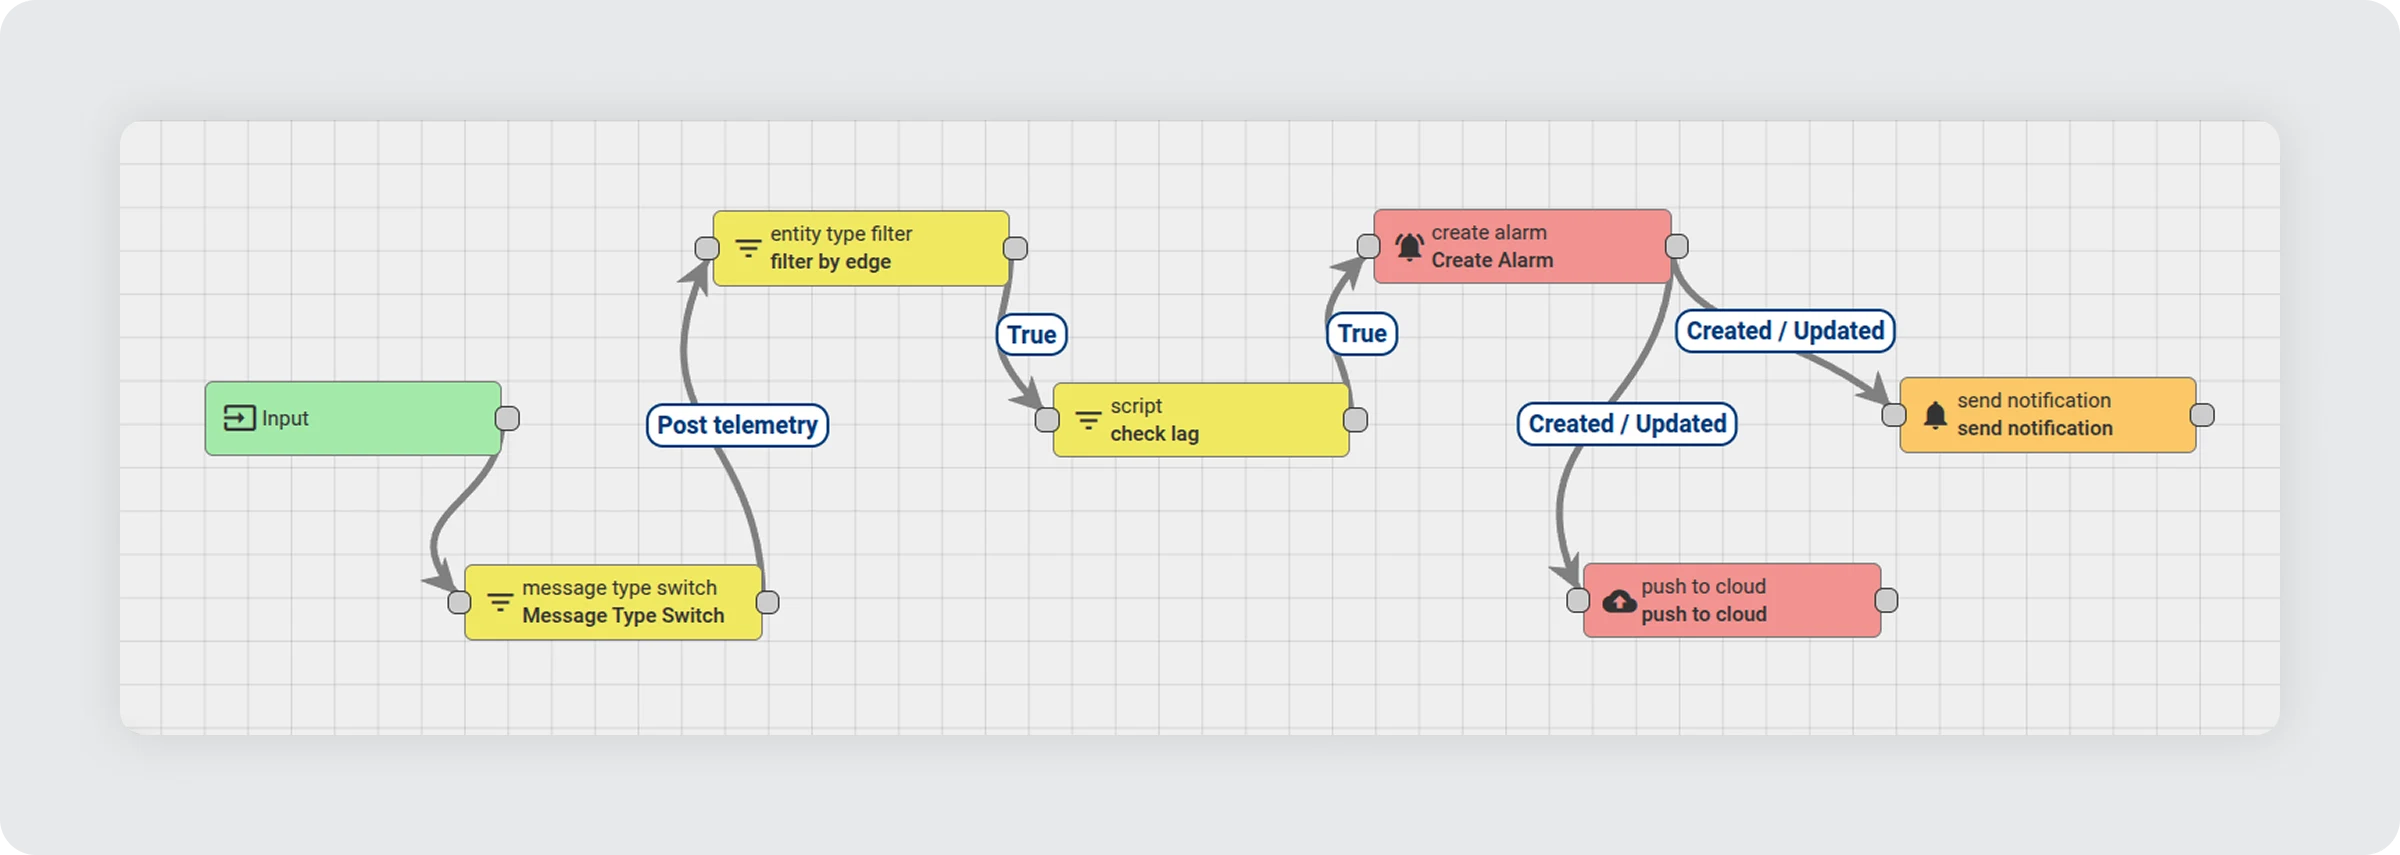
Go Beyond Simple Monitoring: Automate With Rule Engine
Because stats are published as native ThingsBoard telemetry, you can automate responses with the Rule Engine. Set up smart alarms that automatically trigger when a specific condition is met, like a sudden spike in pending messages.
For example:
- IF uplink_lag and downlink_lag > 500 messages
- AND edge_version = 4.2.0
- THEN raise a Critical Lag Detected alarm, assign it to the on-call engineer, and notify via Slack or SMS.
// Collect lag values
var uplinkLag = msg.uplinkMsgsLag != null ? msg.uplinkMsgsLag : 0;
var downlinkLag = msg.downlinkMsgsLag != null ? msg.downlinkMsgsLag : 0;

// ---- FINAL CONDITION ----
// Trigger if lag is too high
return (uplinkLag > 500 || downlinkLag > 500);
This way, your infrastructure doesn’t just detect problems — it reacts to them automatically.
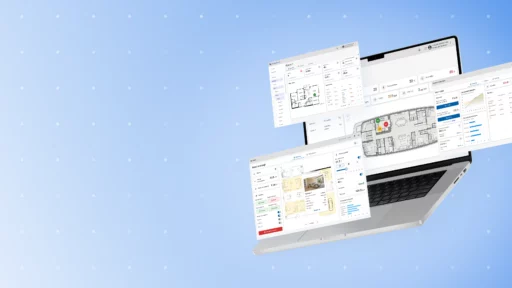
Pre-Configured Dashboard
To get started even faster, we’ve created a ready-to-use dashboard template.
The dashboard gives you visibility at two levels:
- Summary view: View message statistics for all connected Edge instances in one place, including their versions and key telemetry fields. This lets you quickly assess the overall communication health.
- Detailed view: Dive into a specific Edge to analyze its uplink and downlink performance via dedicated graphs to spot delays, failures, or metric lags for this particular instance.
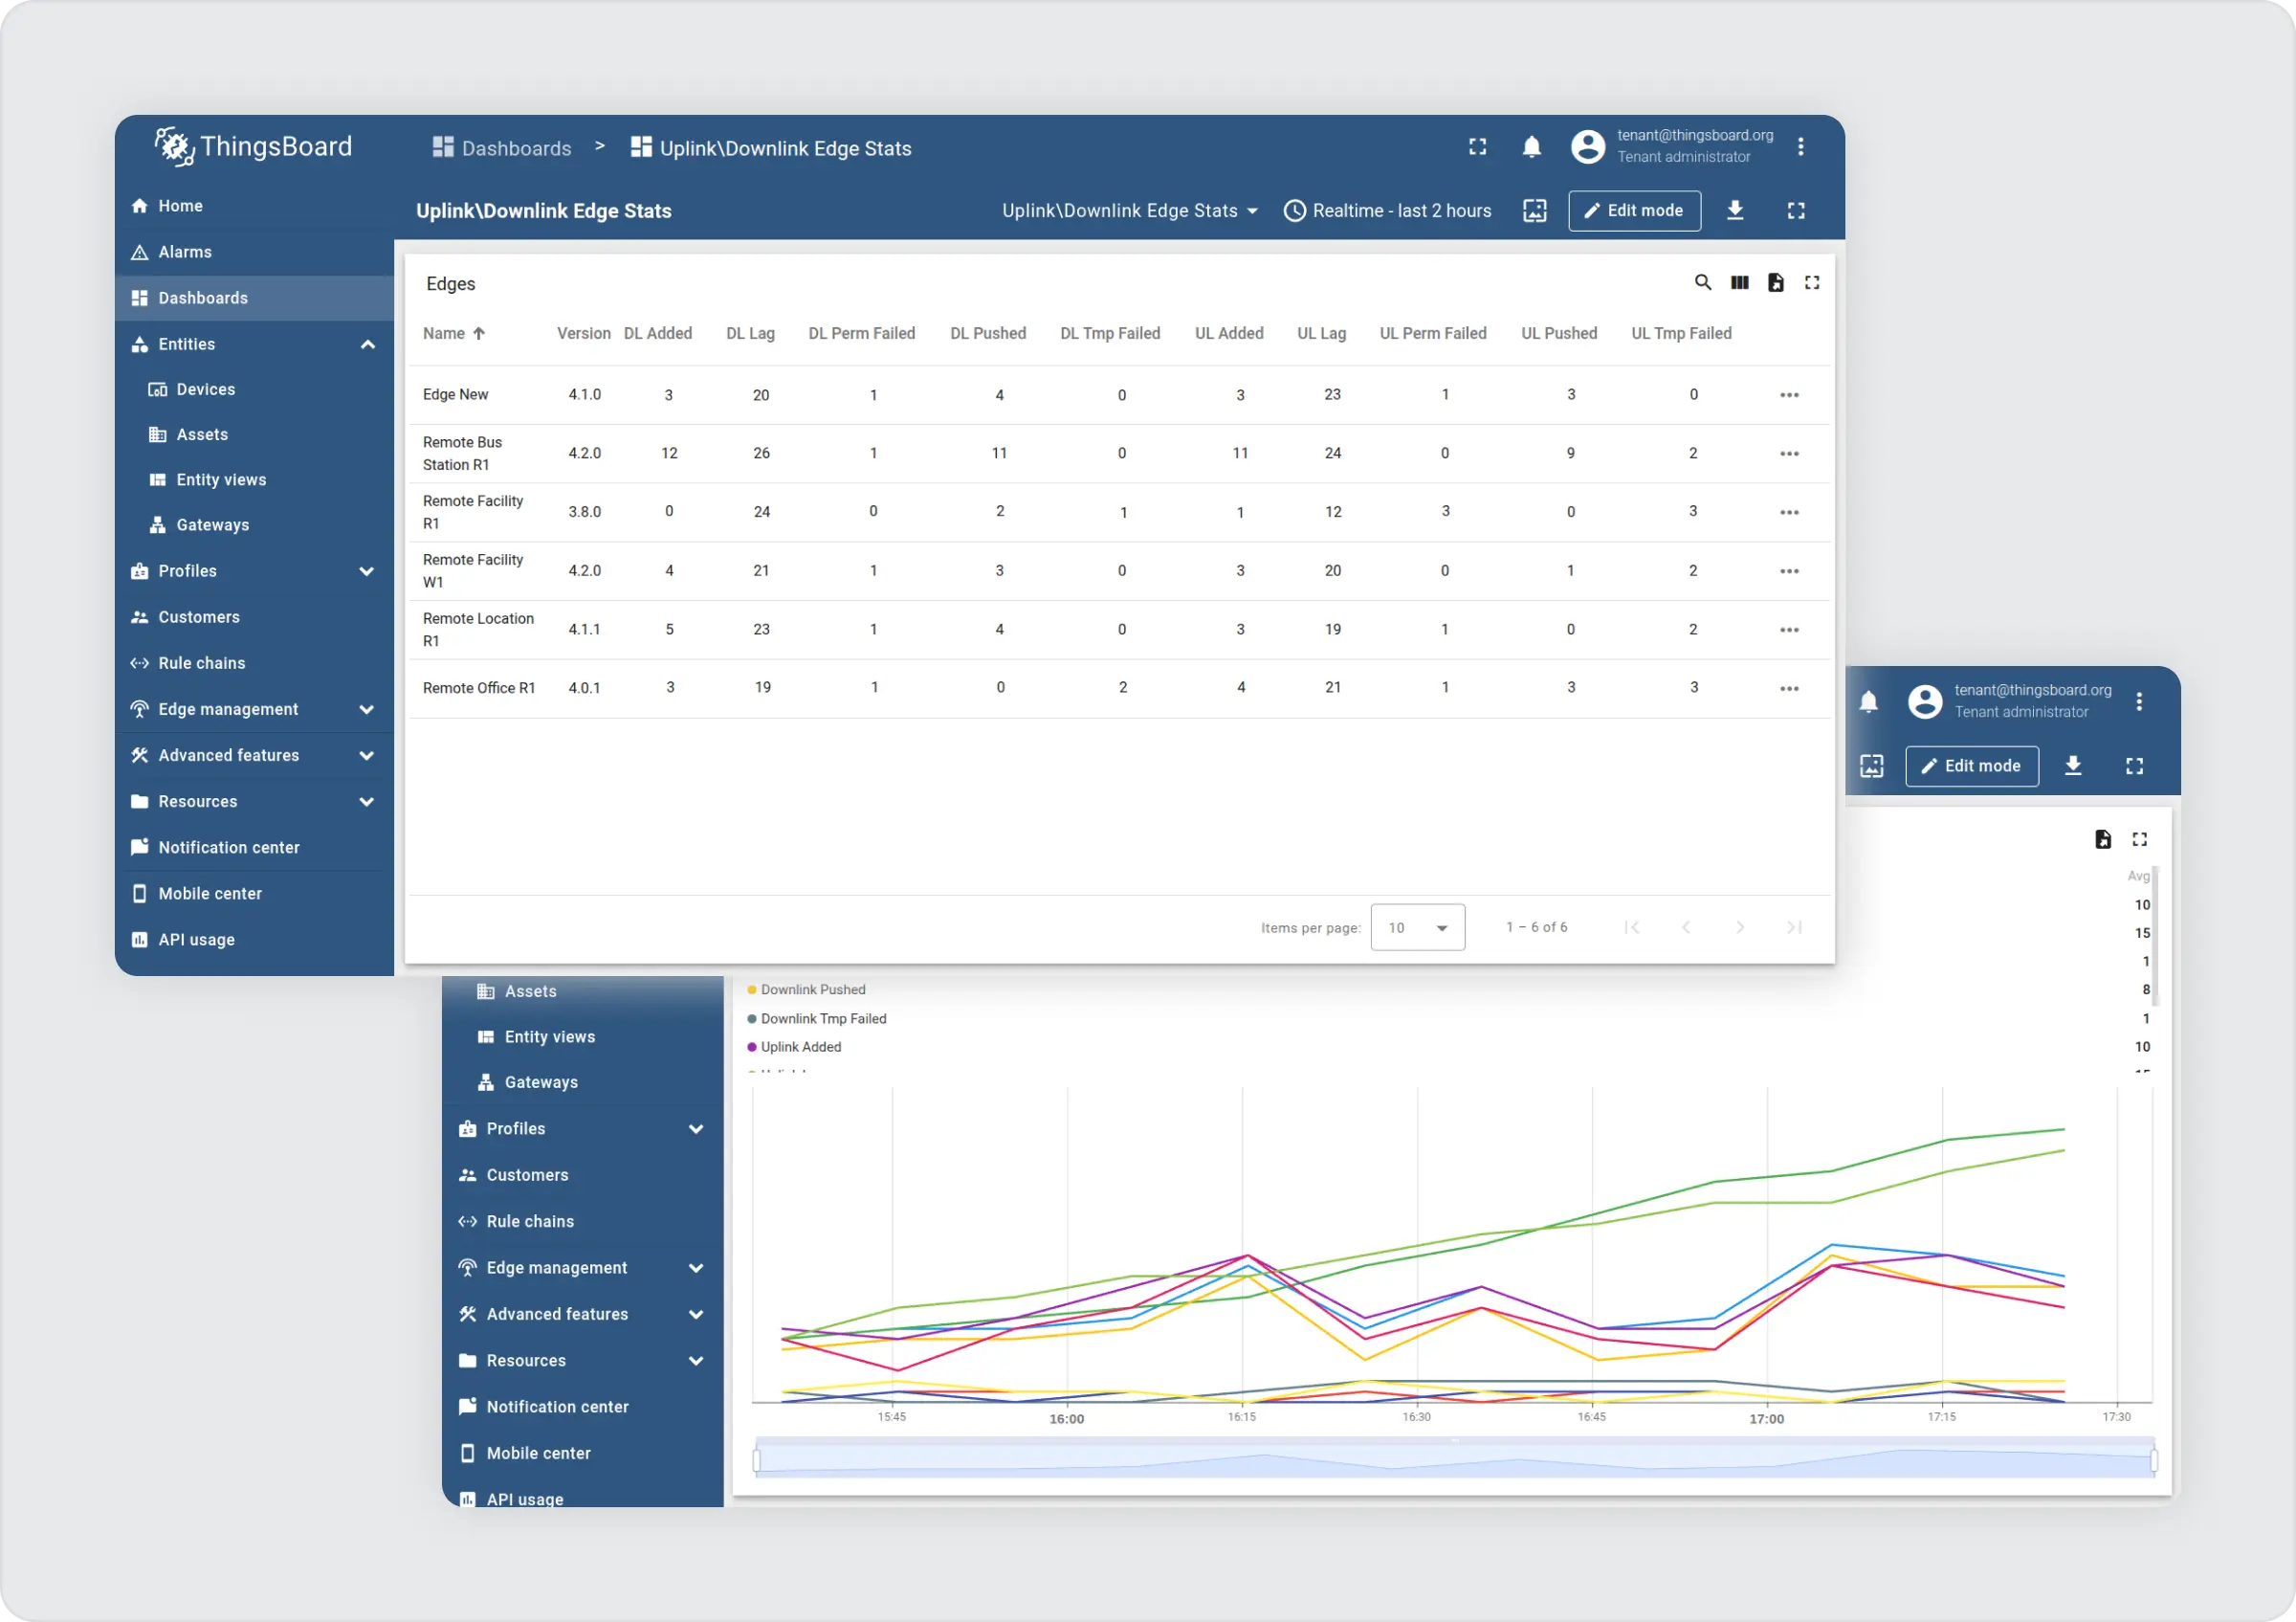
Simply download the dashboard template, import it into your ThingsBoard Cloud instance, and you’re set.
Real-World Use Cases
- Fleet monitoring: find the one lagging Edge in a sea of healthy nodes.
- Proactive maintenance: alert when downlink failure rate crosses a threshold.
- SLA compliance: track latency trends and prove delivery guarantees.
- Capacity planning: use backlog growth to right-size links and intervals.
Key Benefits
With ThingsBoard Edge 4.2, uplink and downlink statistics are now monitored in real time. This allows you to:
- Reduce downtime with early detection of bottlenecks.
- Improve reliability by continuously monitoring message flow health.
- Lower operational risk with proactive alarms and automated workflows.
- Gain confidence in your Edge↔Cloud communication — and in the data powering your business.
Unlock the full power of your IoT deployment with complete visibility into Edge-to-Cloud message flows!
Start Monitoring Today
Ready to stop guessing and start knowing? Upgrade your instance to version 4.2, import the pre-configured dashboard, and take full control of your Edge↔Cloud communication health. Gain the confidence you need to run your IoT deployment with total visibility and reliability.