
Have you ever wanted to evaluate an IoT platform for your organization, but didn’t have a single physical device ready to connect?
Or maybe you needed to run a live demo for a client — tomorrow morning — and your hardware was sitting in a warehouse two countries away?
Perhaps you had a hypothesis about how your system would respond to a sensor failure, but testing it on real equipment felt too risky?
If any of this sounds familiar, you are not alone.
One of the most common friction points in IoT development and evaluation is the dependency on physical hardware.
Getting devices, configuring them, connecting them — it all takes time, budget, and technical effort. And when something goes wrong, you often can not tell whether the problem is with the platform or the hardware itself.
This is exactly the problem the ThingsBoard Device Emulator solves.
What is the ThingsBoard Device Emulator?
The Device Emulator is a built-in feature in ThingsBoard Cloud that lets you spin up virtual devices in seconds, stream live telemetry to your dashboards, and simulate real-world conditions —all within your environment.
These aren’t simplified versions of real devices. A virtual device behaves exactly like a real one:
- It sends live data continuously on a real schedule
- It updates your dashboards in real time
- It responds to commands and control actions immediately
- It can simulate different operating conditions through scenario switching
Think of it as a sandbox that mirrors production — without the cost, the logistics, or the risk.
Who Is This For?
The Device Emulator is useful across a wide range of situations:
| Situation | How the Emulator Helps |
| Evaluating ThingsBoard for your organization | Explore all platform features from day one, without hardware procurement |
| Preparing a sales demo | Set up a realistic, live IoT environment in minutes |
| Running a training session | Give participants hands-on access to real data flows |
| Testing a hypothesis or PoC | Simulate edge cases, failure states, and unusual conditions safely |
| Developing dashboards or rules | Work with continuous data without needing a connected device |
How Does It Actually Work?
When you create a virtual device, ThingsBoard automatically handles everything behind the scenes:
1. A device record is created in your account — exactly as if you had registered a physical device.
2. A dashboard is automatically generated and linked to the device. This dashboard is created once per device type — not once per individual emulator. If you create multiple devices of the same type, they will all share the same dashboard. You can find it under Dashboards in the main navigation.
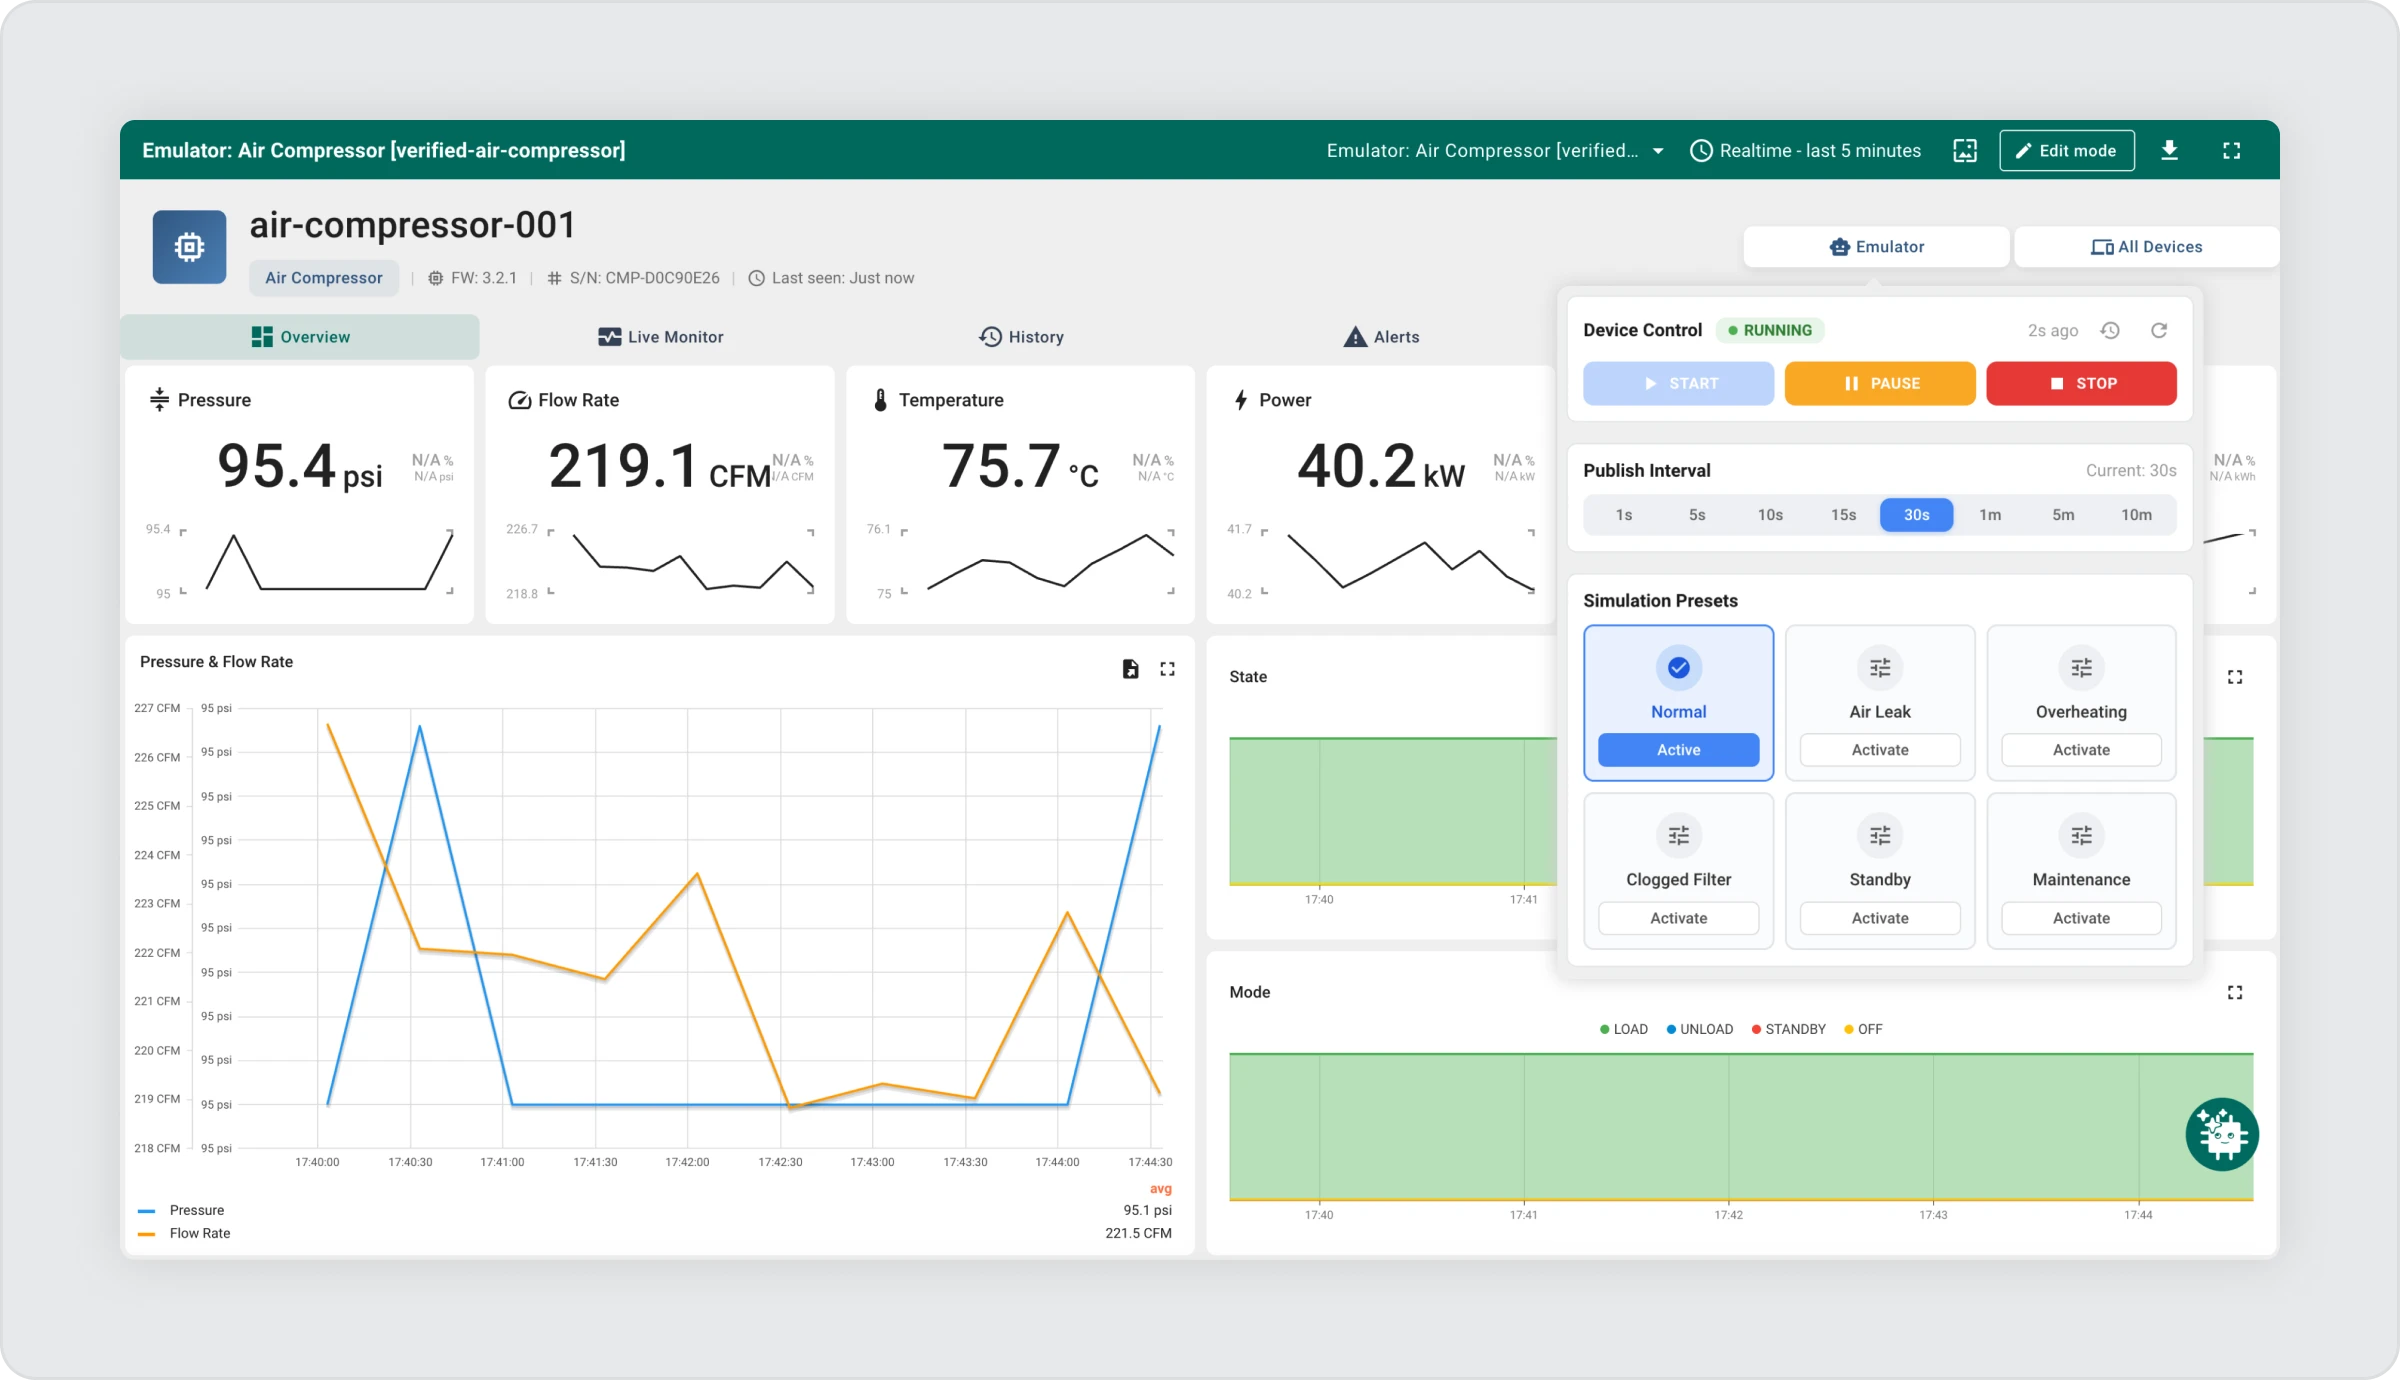
Each virtual device has its own dedicated dashboard where you can monitor live data and interact with the device in real time.
To open a dashboard for any device:
- Find the device in the Emulators List
- Click “Open” in the Dashboard column
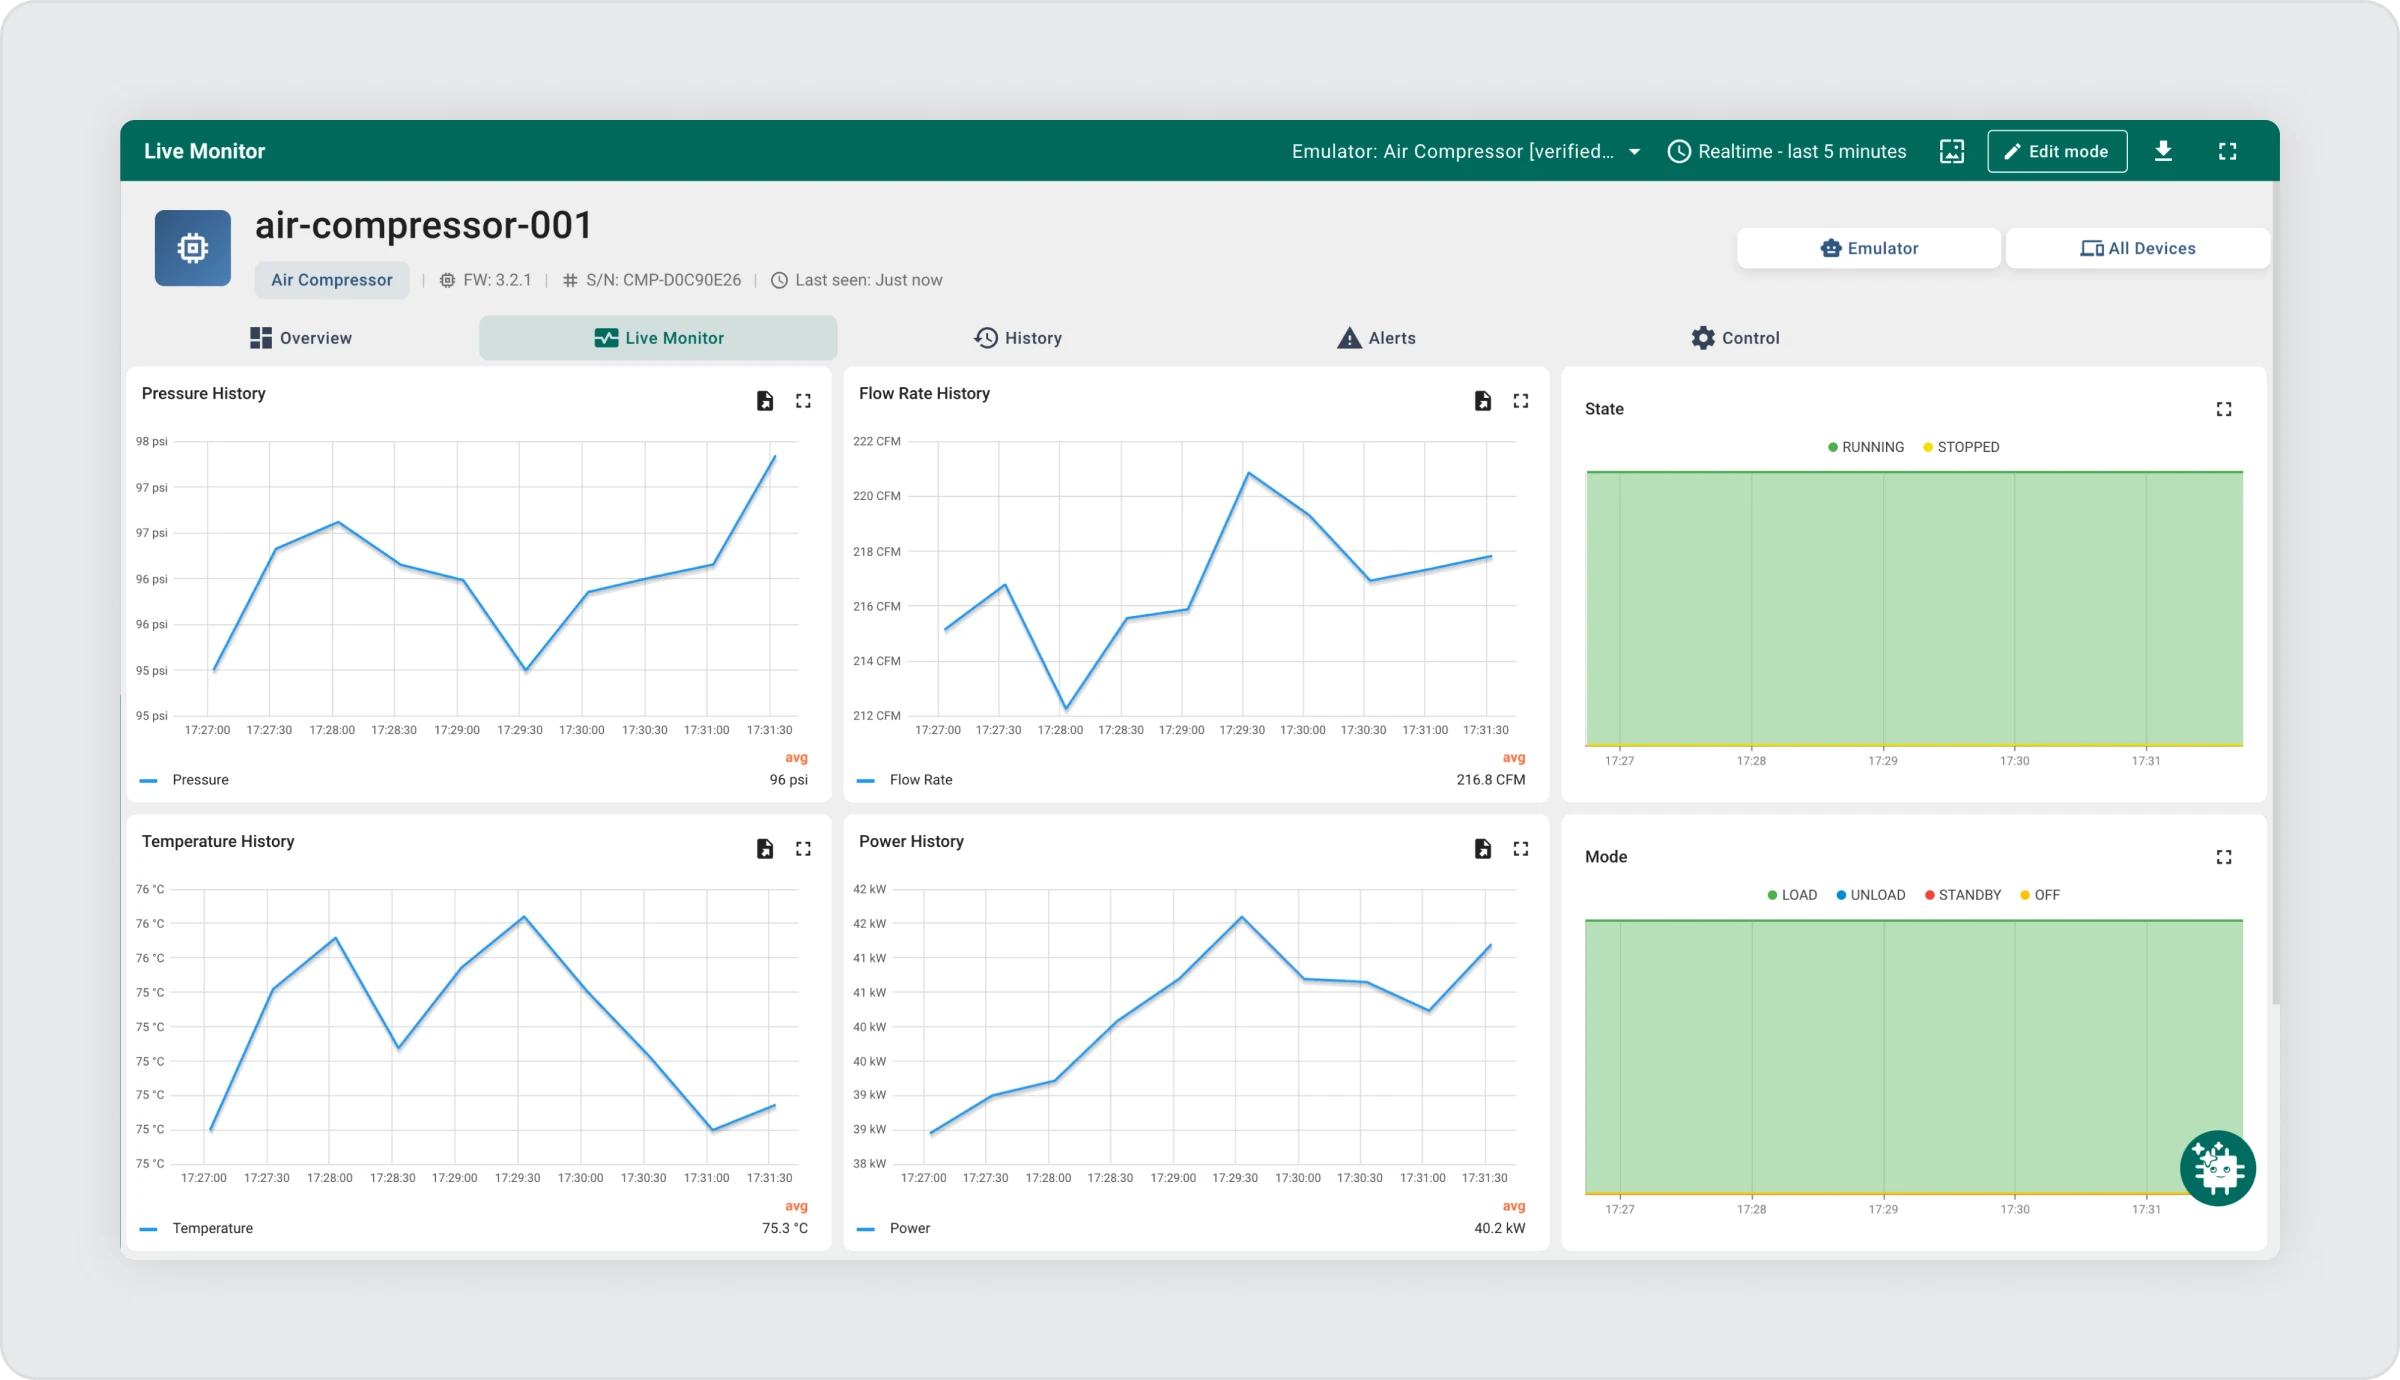
- The dashboard opens and displays:
- Live charts updated in real time
- Current sensor values
- A control panel for managing the device
Tip: You can have multiple device dashboards open at the same time in separate browser tabs — useful when comparing the behavior of two devices running different scenarios side by side.
3. Data starts flowing immediately — the emulator begins sending simulated sensor readings (such as temperature, battery level, or door status) to the platform on a regular interval.
You do not configure any of this manually. It is ready within seconds.
The emulator and ThingsBoard are always in sync. Any action — whether pausing, stopping, or changing scenarios — is immediately reflected in the platform. Open the dashboard, and you’ll see exactly what the device is doing in real time.
Key Concepts
Before you start, here is a brief explanation of the terms used throughout this guide.
| Term | What it means |
| Emulator | One running virtual device. You can have many emulators at the same time. |
| Emulator Profile | A template that defines what type of device to simulate (for example, a cold storage unit or a logistics tracker). |
| Scenario | A predefined behavioral state that controls what kind of data the device sends. For example, a cold storage unit can operate in Normal mode, Door Left Open mode, or Sensor Fault mode. Switching scenarios instantly changes the data stream to reflect that condition. |
| Telemetry | The stream of data values a device sends over time (temperature, status codes, battery percentage, etc.). |
| Telemetry Rate | How often data is sent — for example, once every 5 seconds or once every 10 minutes. |
| Dashboard | A visual interface used to monitor device data and interact with it through charts, gauges, and controls. |
Getting Started: Creating Your First Virtual Device
Step 1 — Open the Emulators
The Device Emulator has two main widgets:
- Emulator Catalog — all available device types you can simulate
- Emulators — all virtual devices you have already created
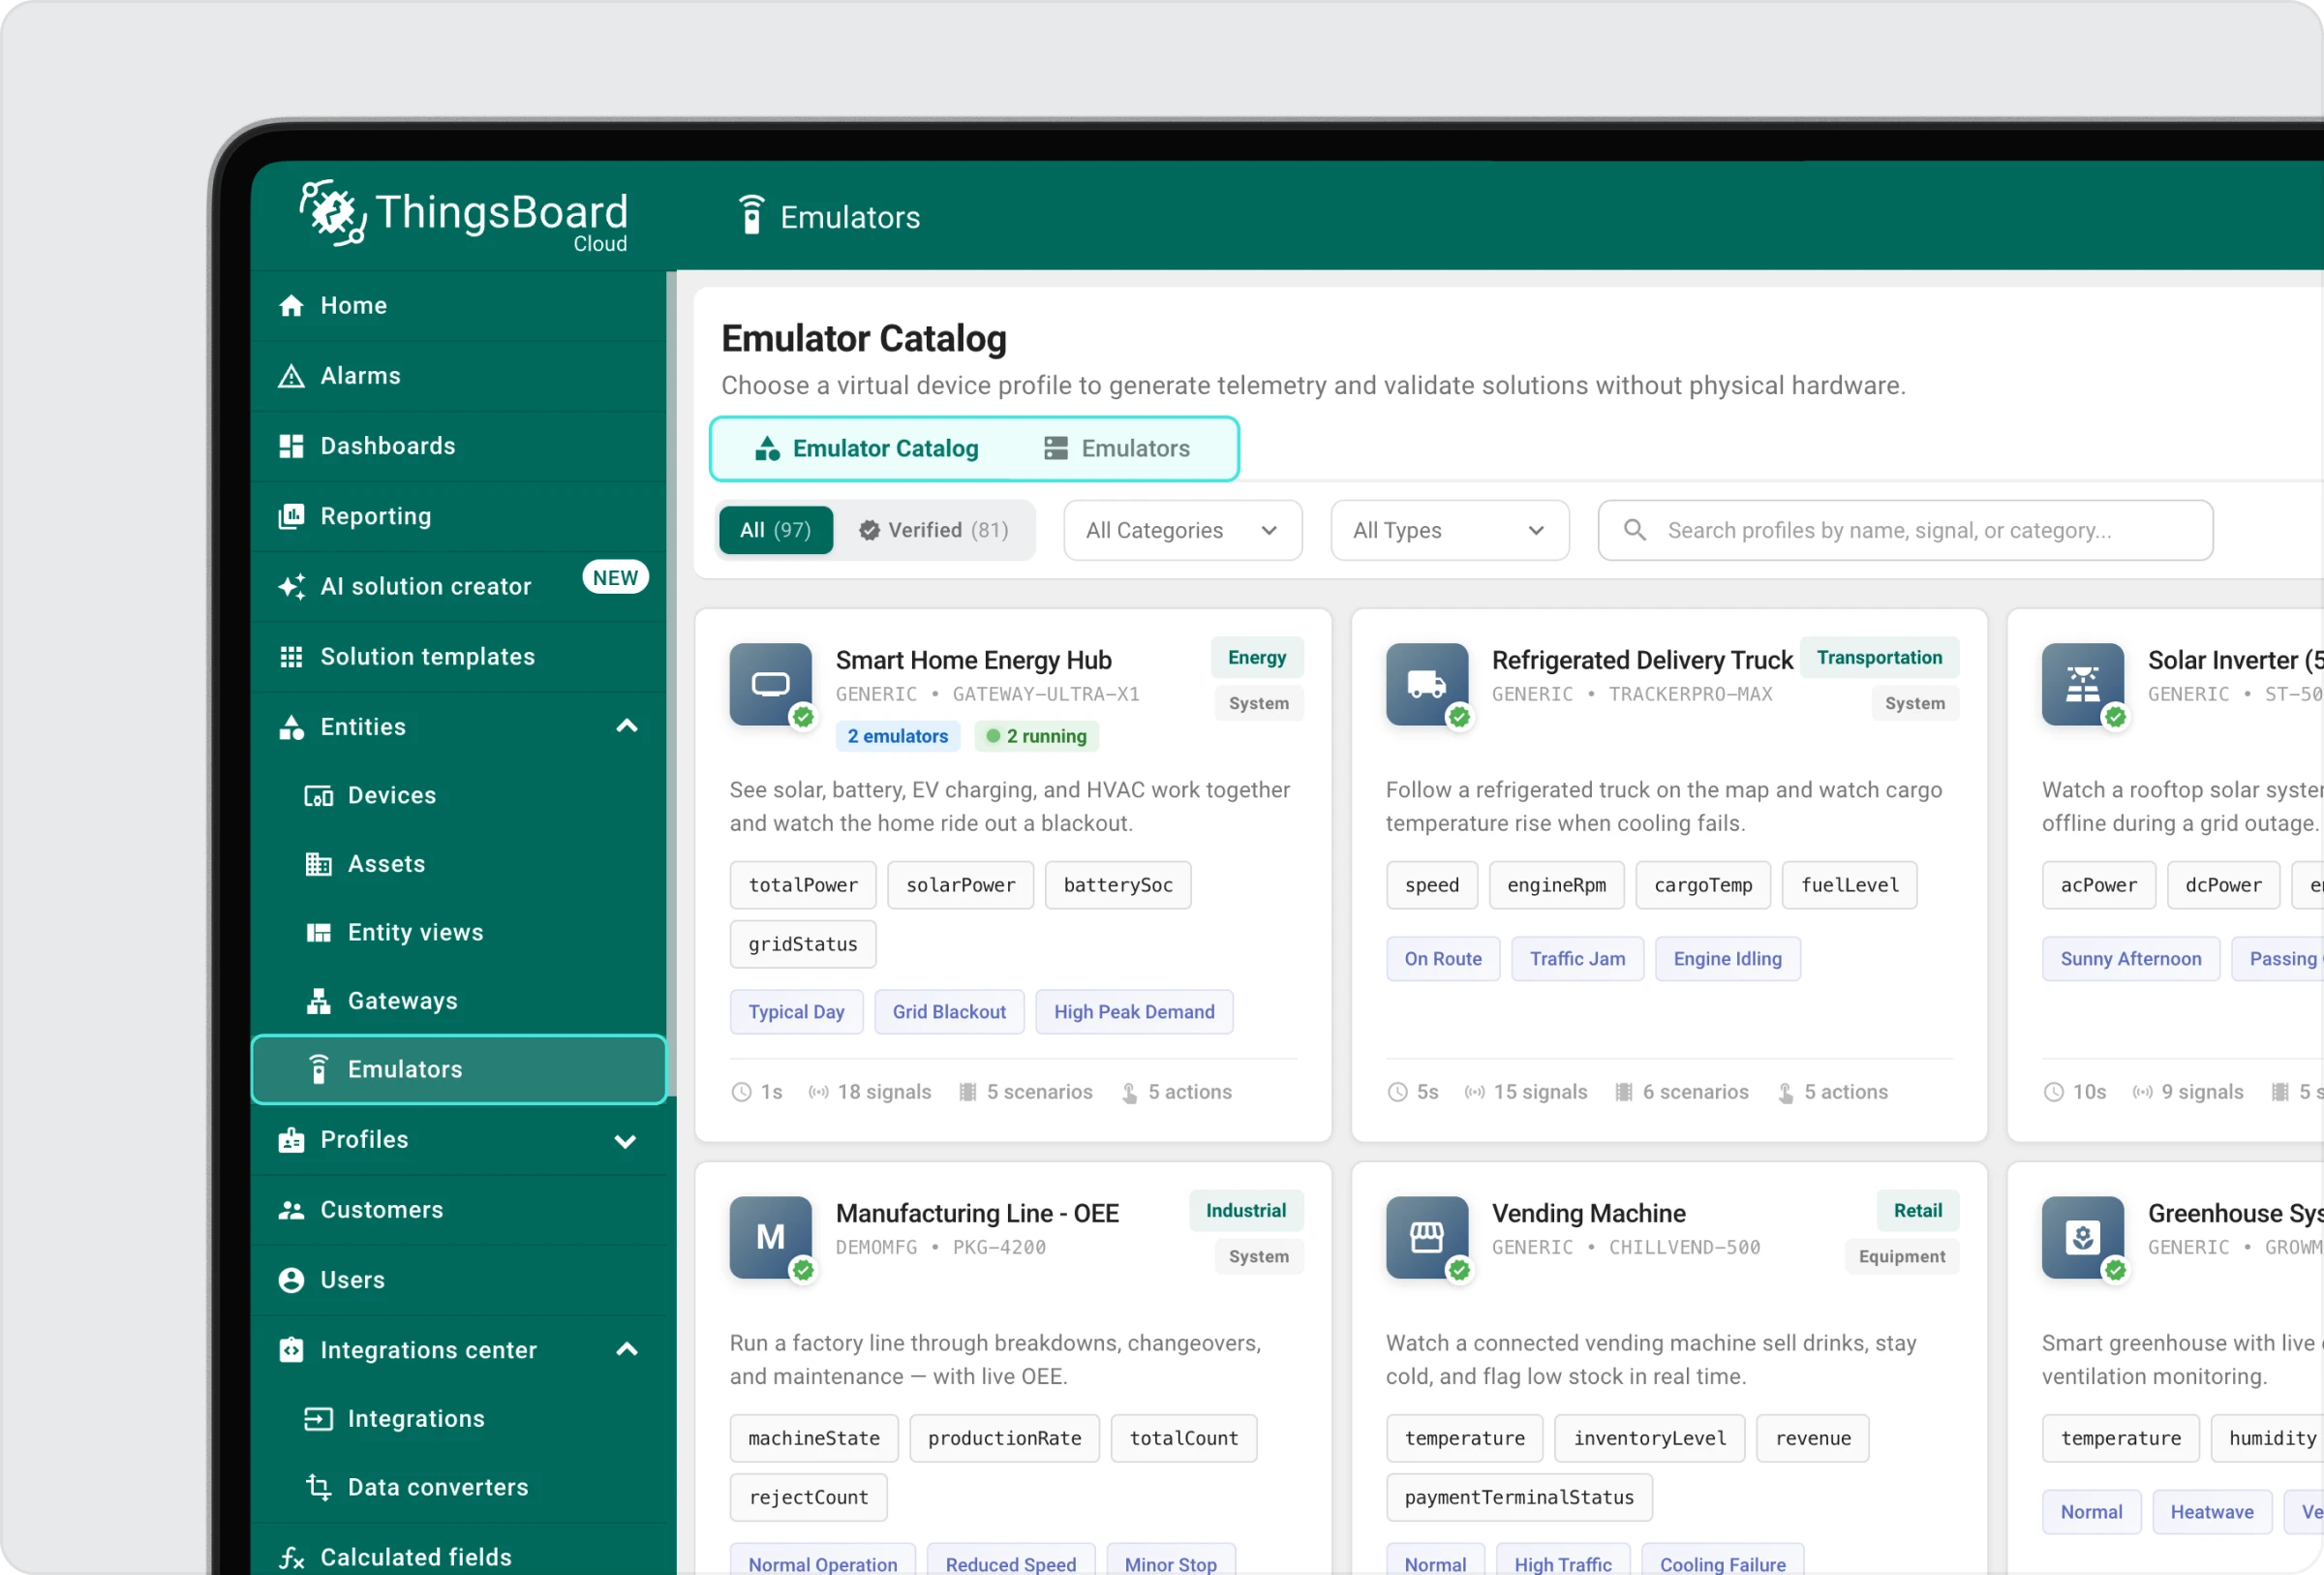
Step 2 — Choose a Device Type
Go to the Emulator Profile Catalog and click on the device type you want to simulate. You will see a description of what it does and what scenarios it supports.
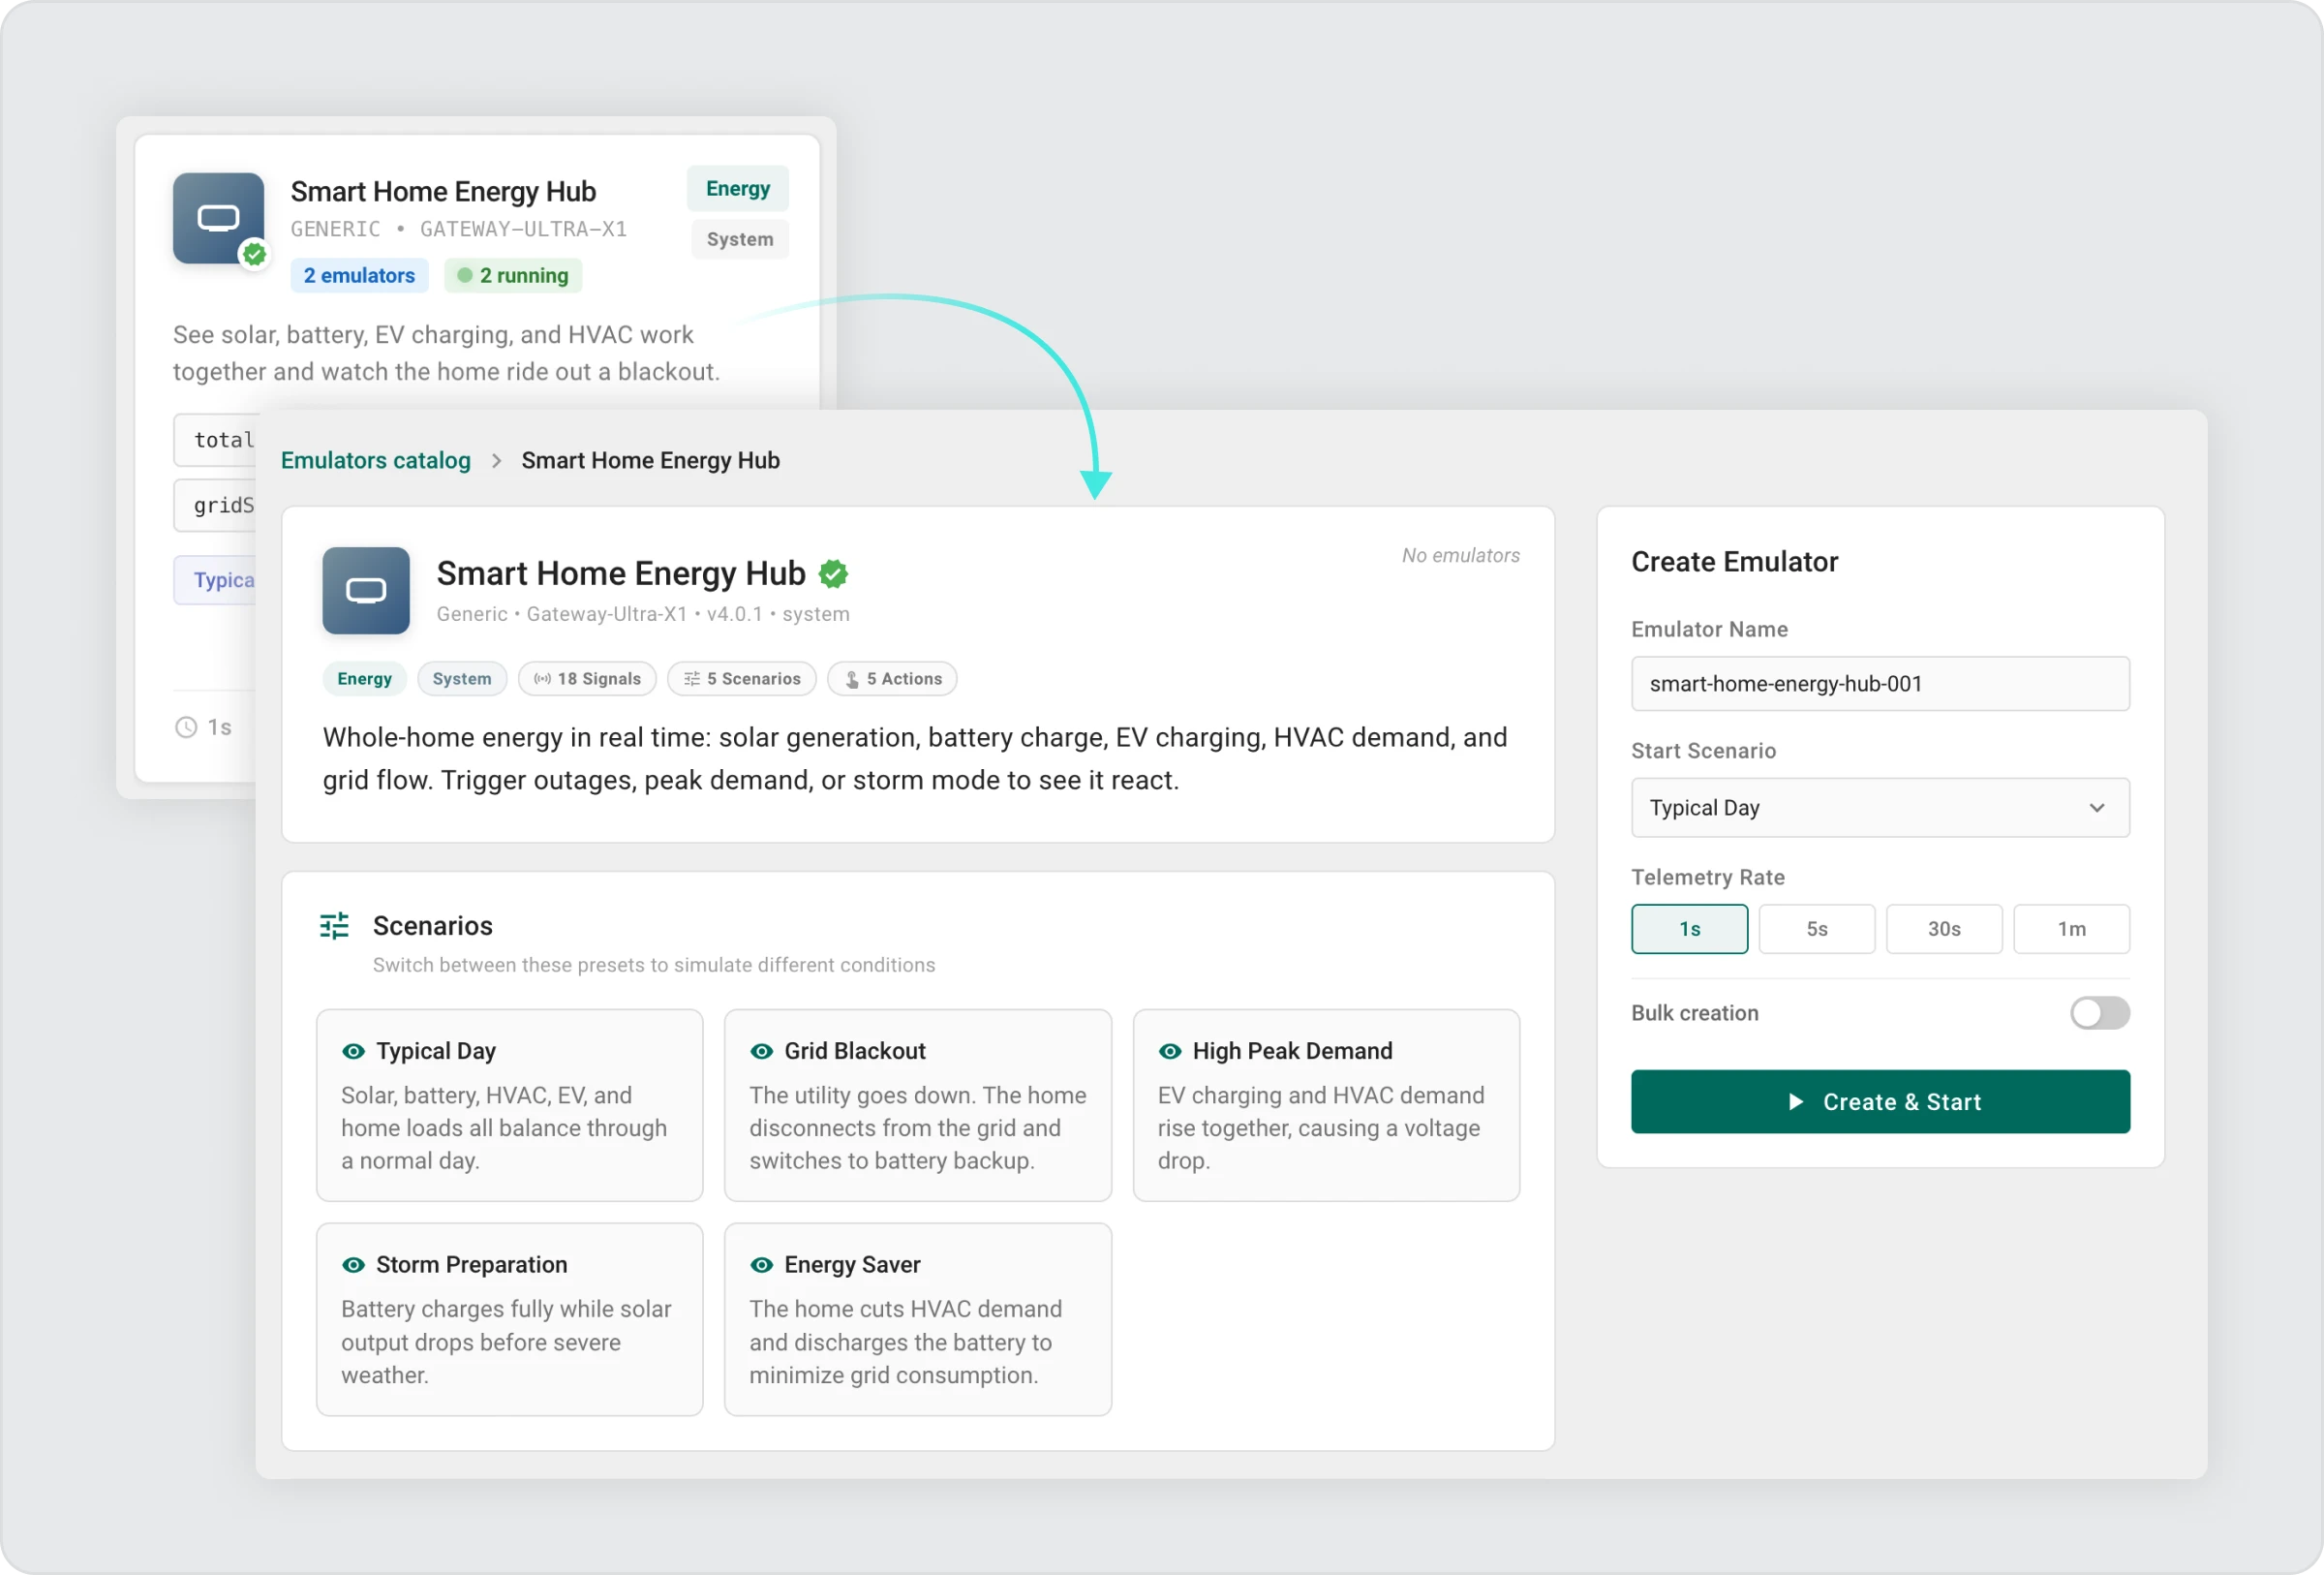
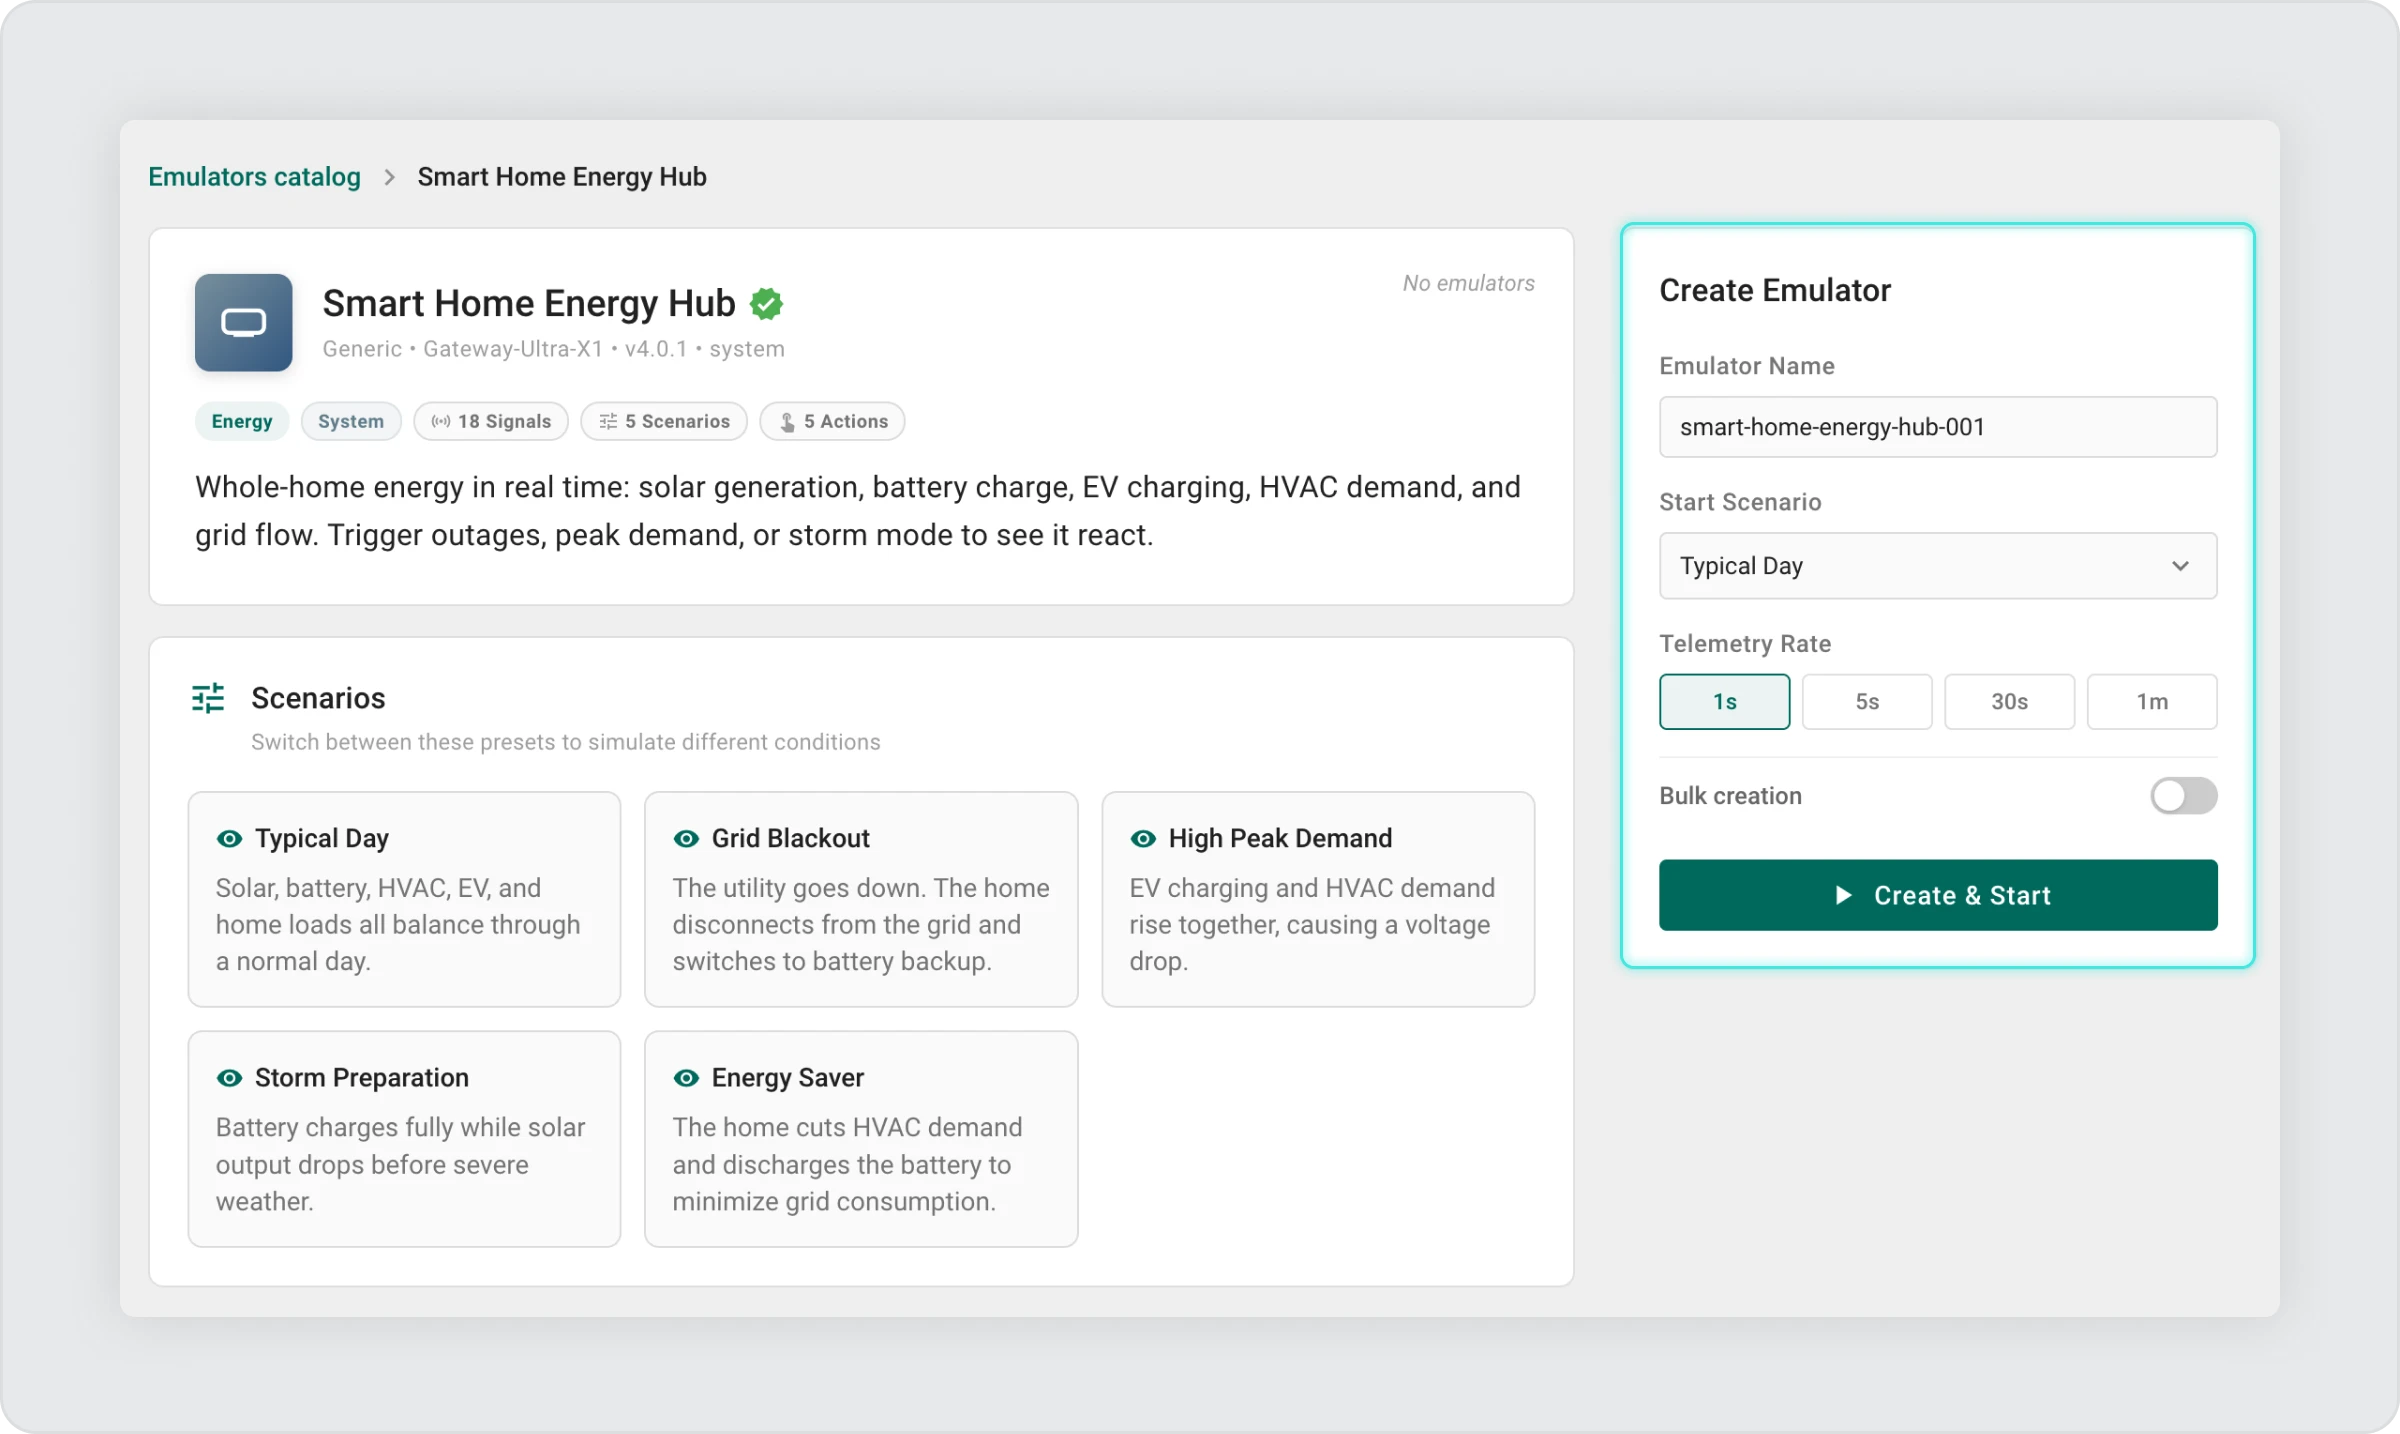
Step 3 — Create an Emulator
In the form that appears, you can optionally:
- Enter an emulator name — give your device a custom name to make it easy to identify in the Emulators List, or leave the default name
- Choose a start scenario — the initial behavioral state for the device (for example, Normal, Door Left Open, or Sensor Fault), or keep the default
- Set the telemetry rate — how frequently the device will send data updates (for example, every 5 seconds for a live demo, or every 1 minute for a background simulation)
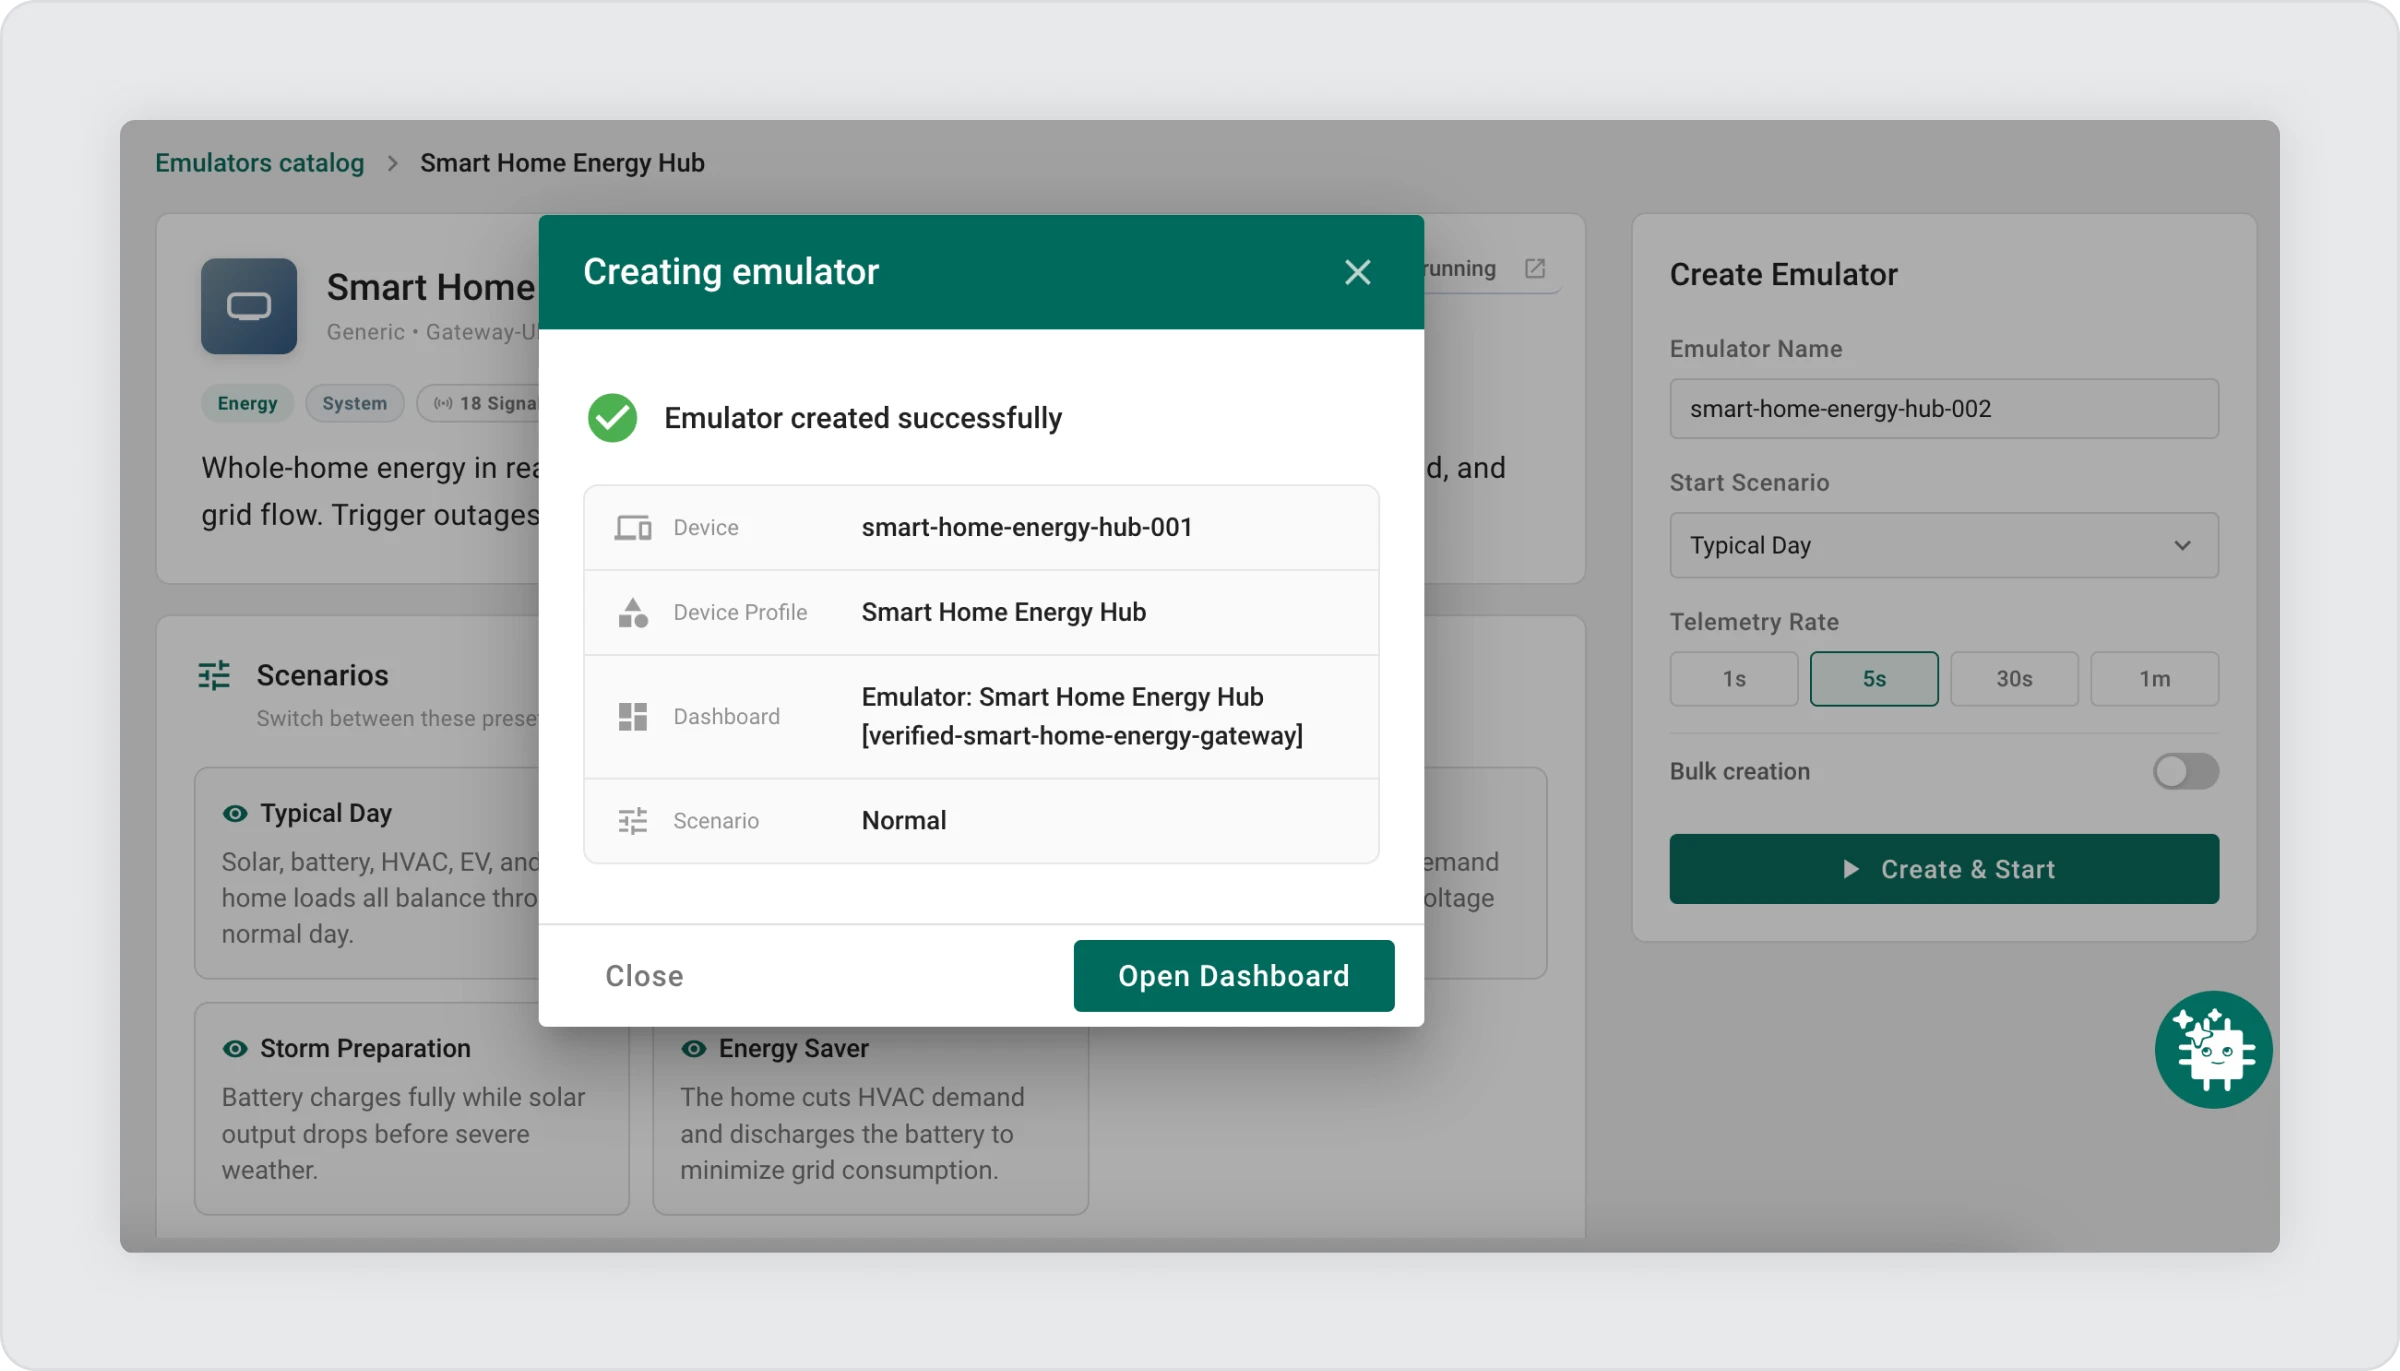
After entering all the data, click Create&Start.
Step 4 — Watch It Run
Within a few seconds:
- The device appears in the Emulators List with a Running status
- Click “Open Dashboard” to go to the dashboard.
- A control panel widget is added to the dashboard
- Telemetry begins streaming to the platform in real time
That’s it. Your virtual IoT device is live.
Where to Find What Was Created
Everything the emulator creates is also accessible in your ThingsBoard account as real platform entities:
Device
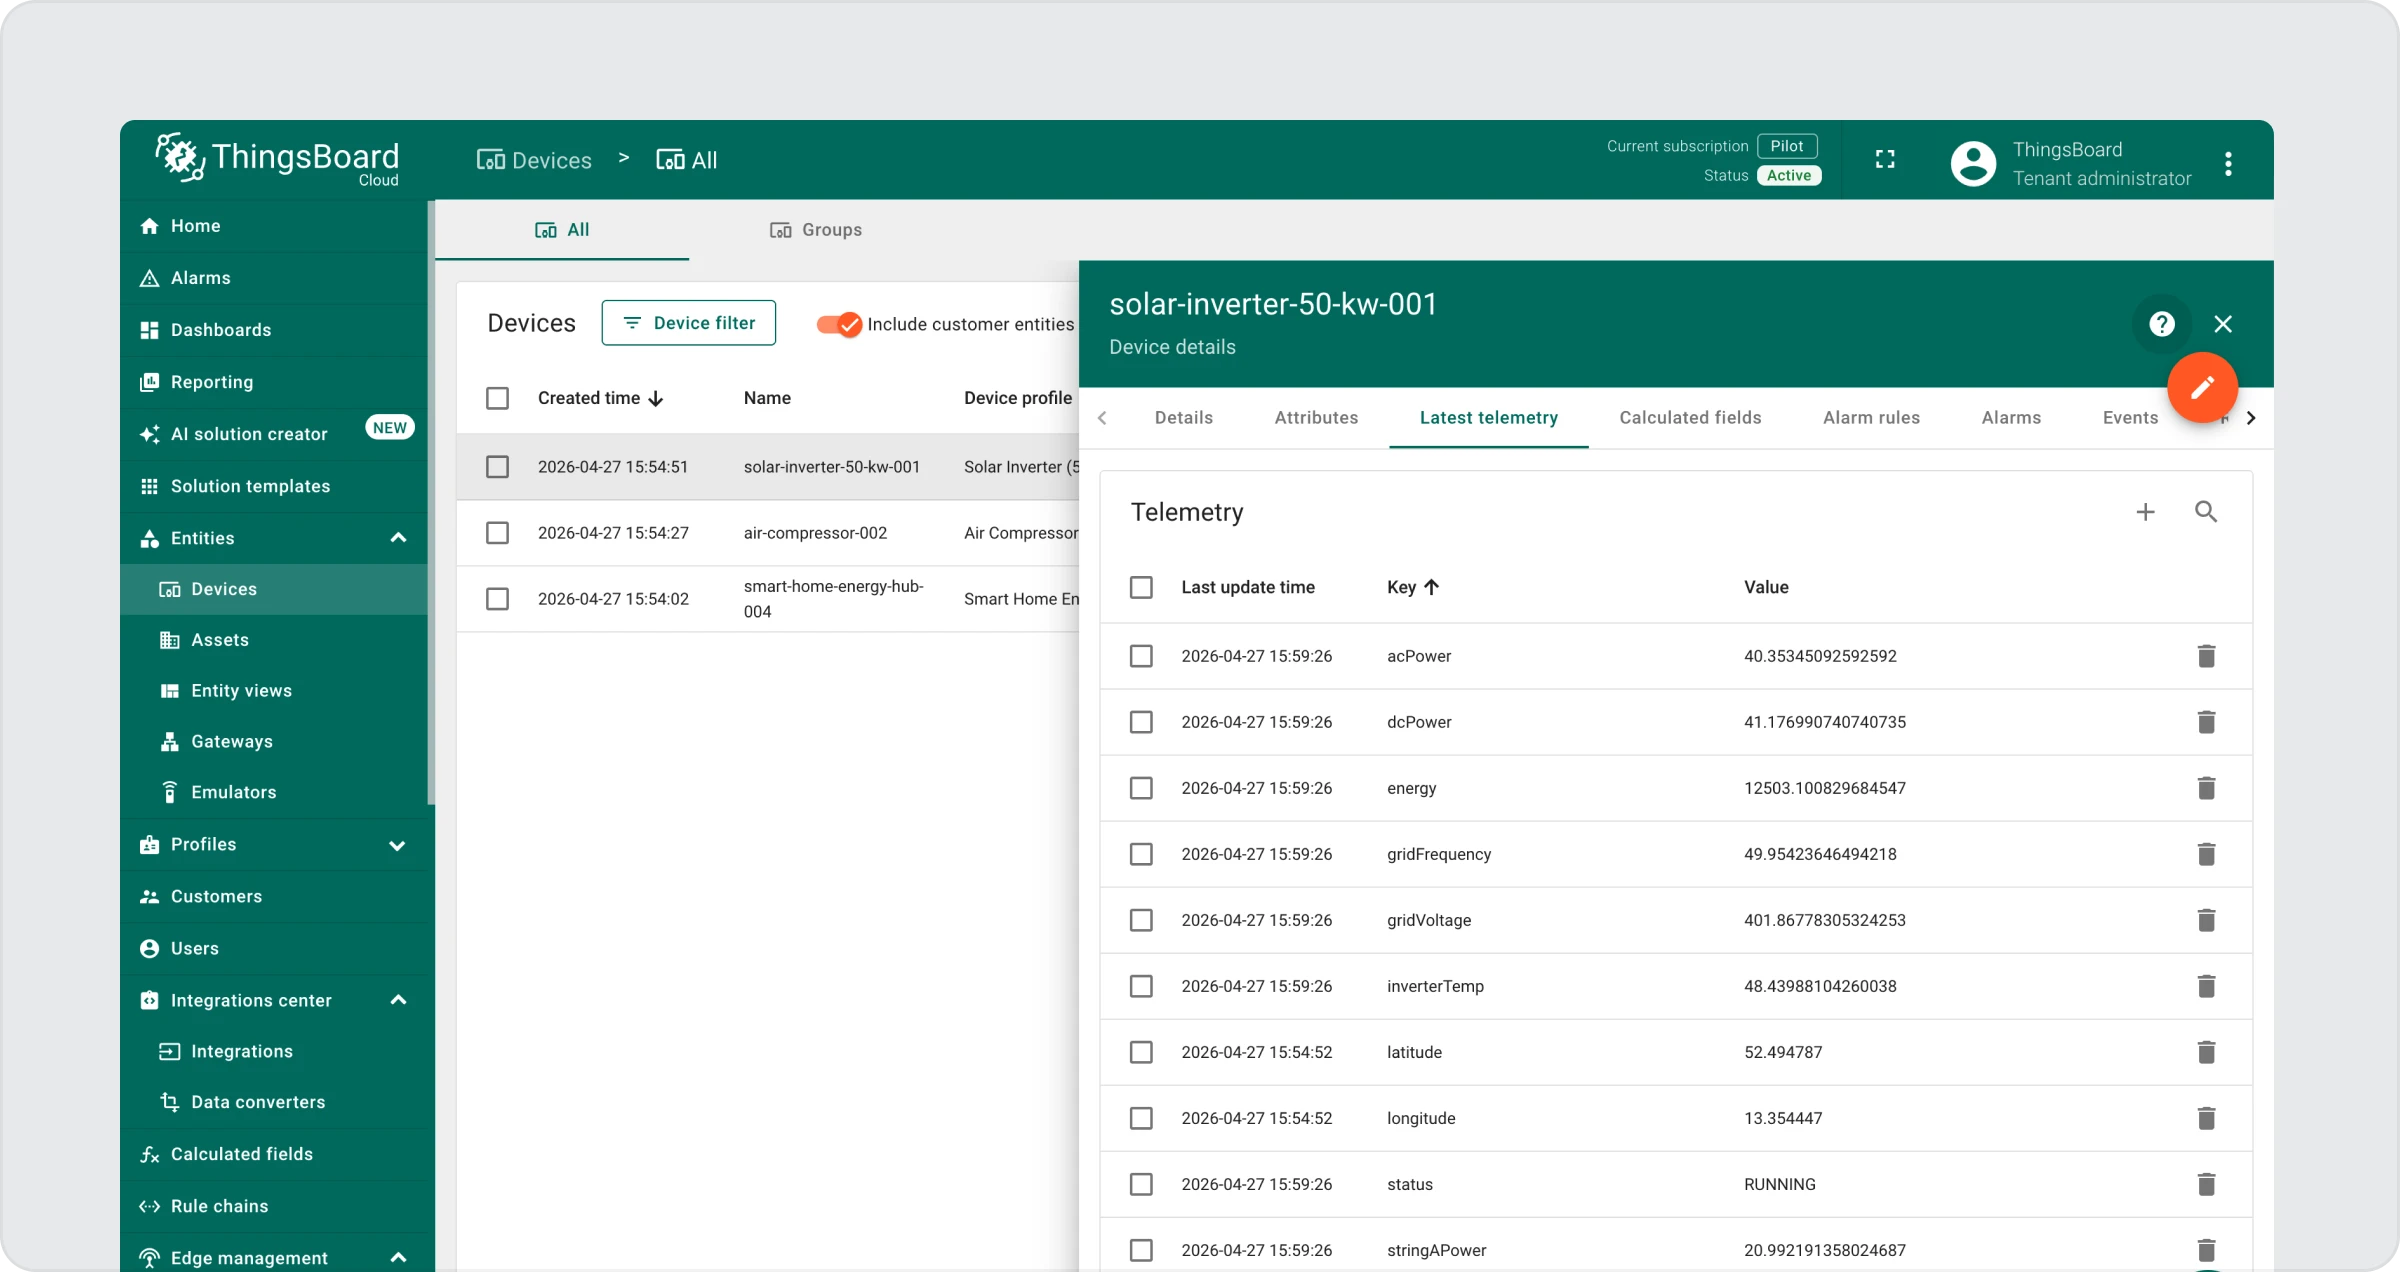
The virtual device is registered as a real device in your ThingsBoard account. You can find it under Entities → Devices in the main navigation. It behaves exactly like a manually created device — you can view its telemetry, assign it to customer accounts, or use it in rule chains.
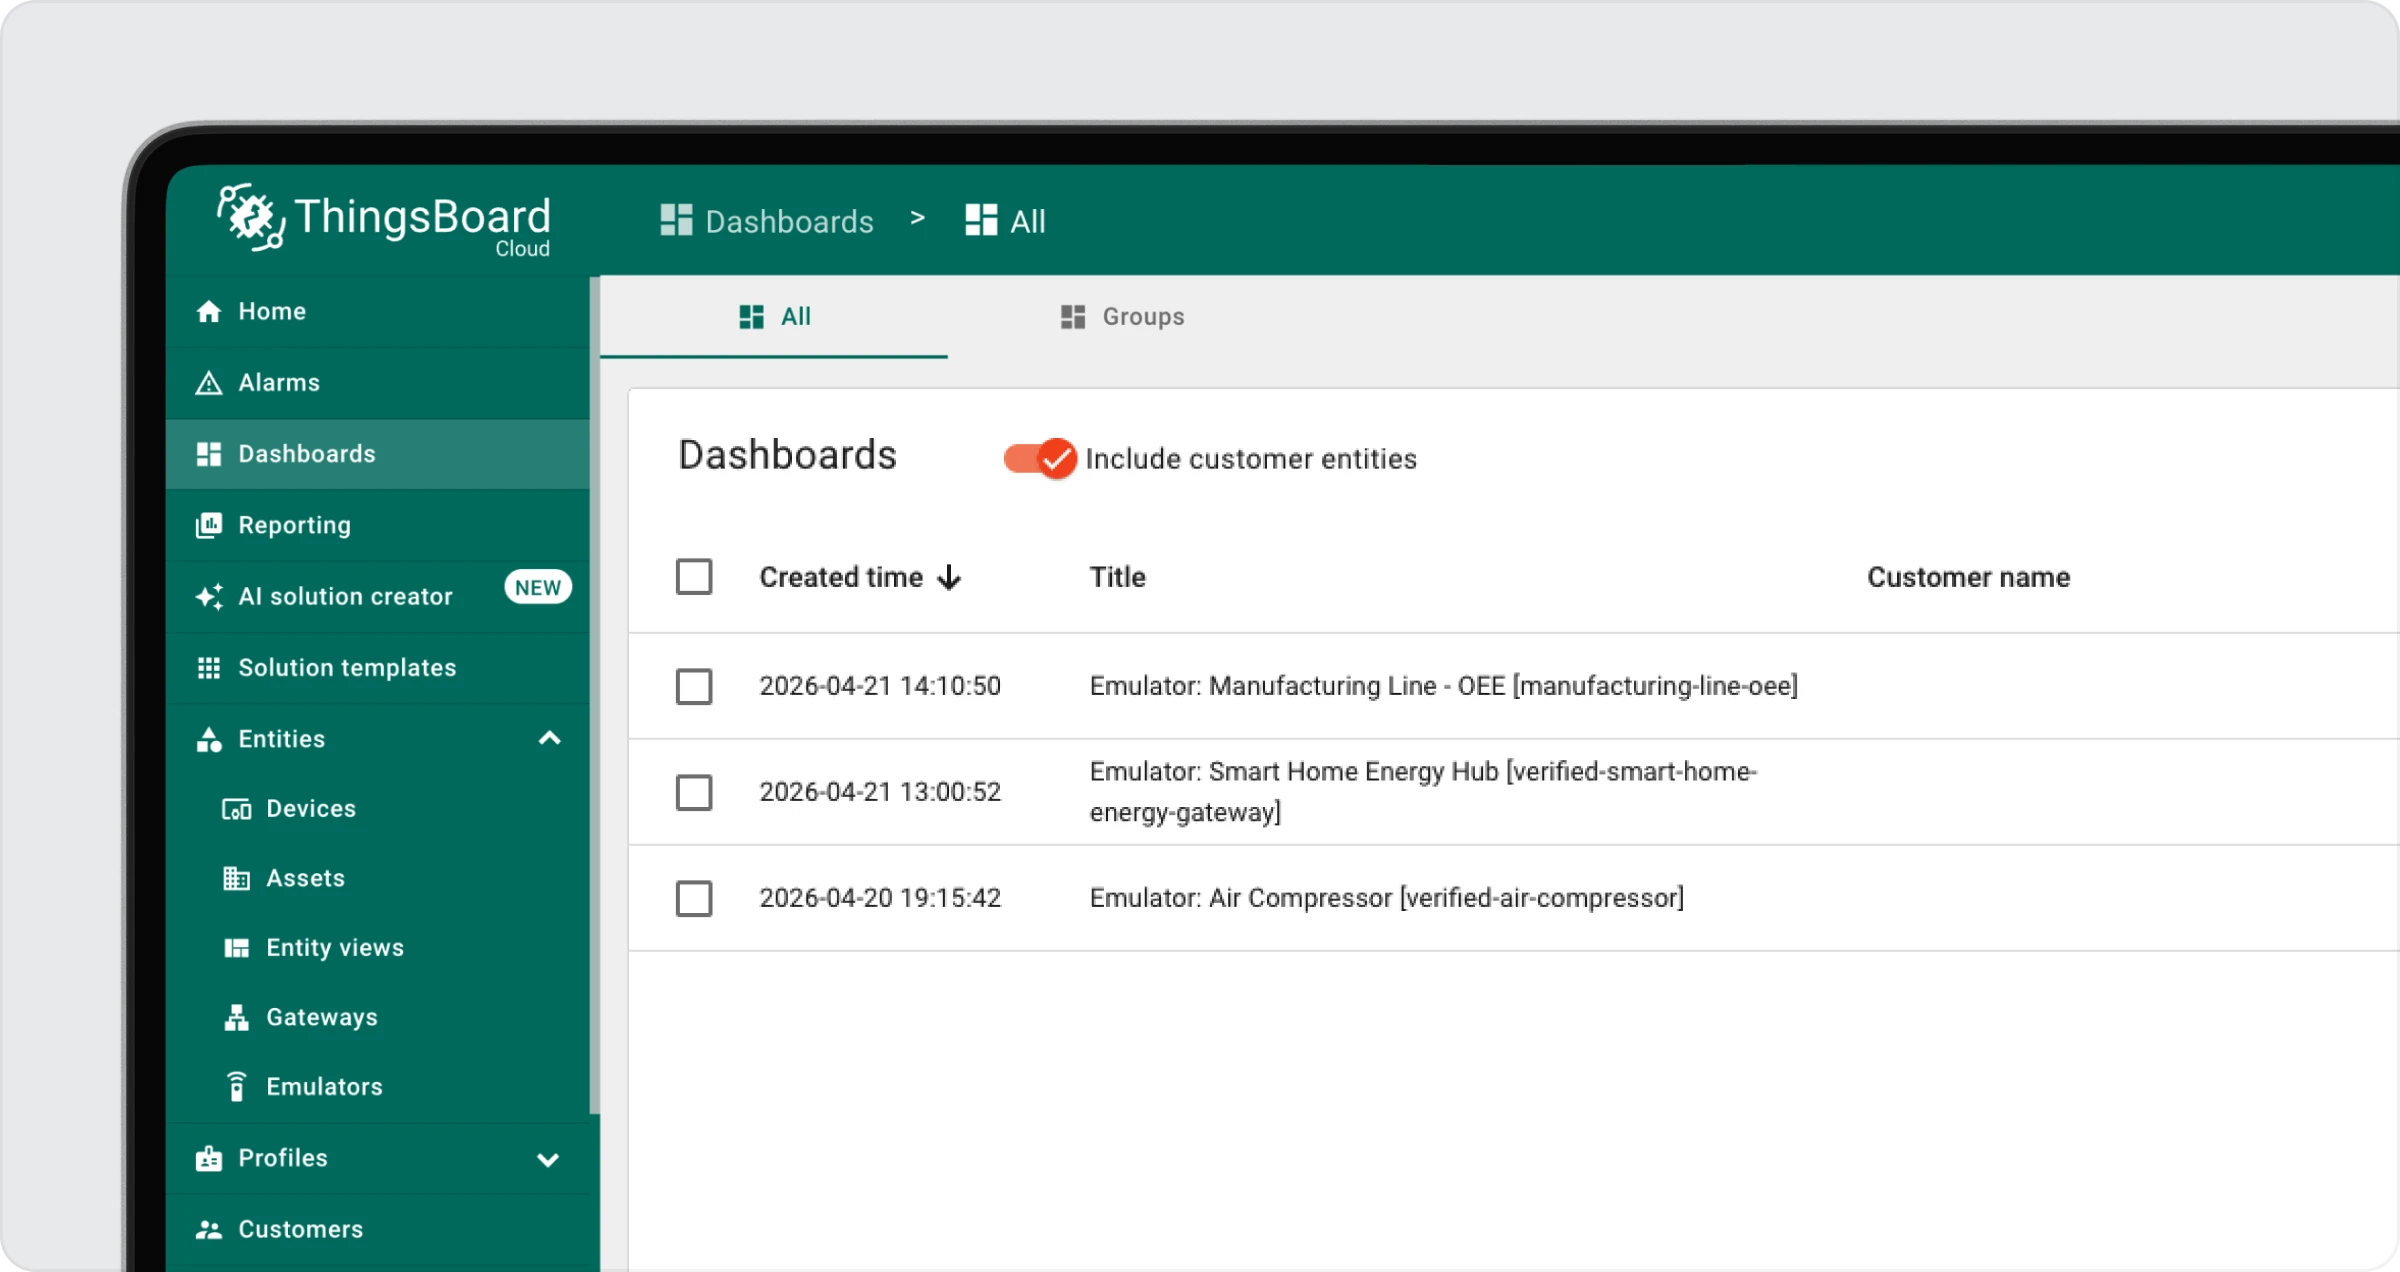
Dashboard
A dashboard is automatically generated and linked to the device. You can find it under Dashboards in the main navigation.
How Dashboard Creation Works
The dashboard is not created for every individual emulator — it follows this logic:
- When you create your first emulator of a device type, a Device Profile is created, and a dashboard is generated and linked to that profile
- When you create a second or third emulator of the same device type, no new dashboard is created — all emulators of the same type share the same dashboard
- If you rename an emulator, the dashboard is not recreated — the existing dashboard simply displays data from all devices of that type
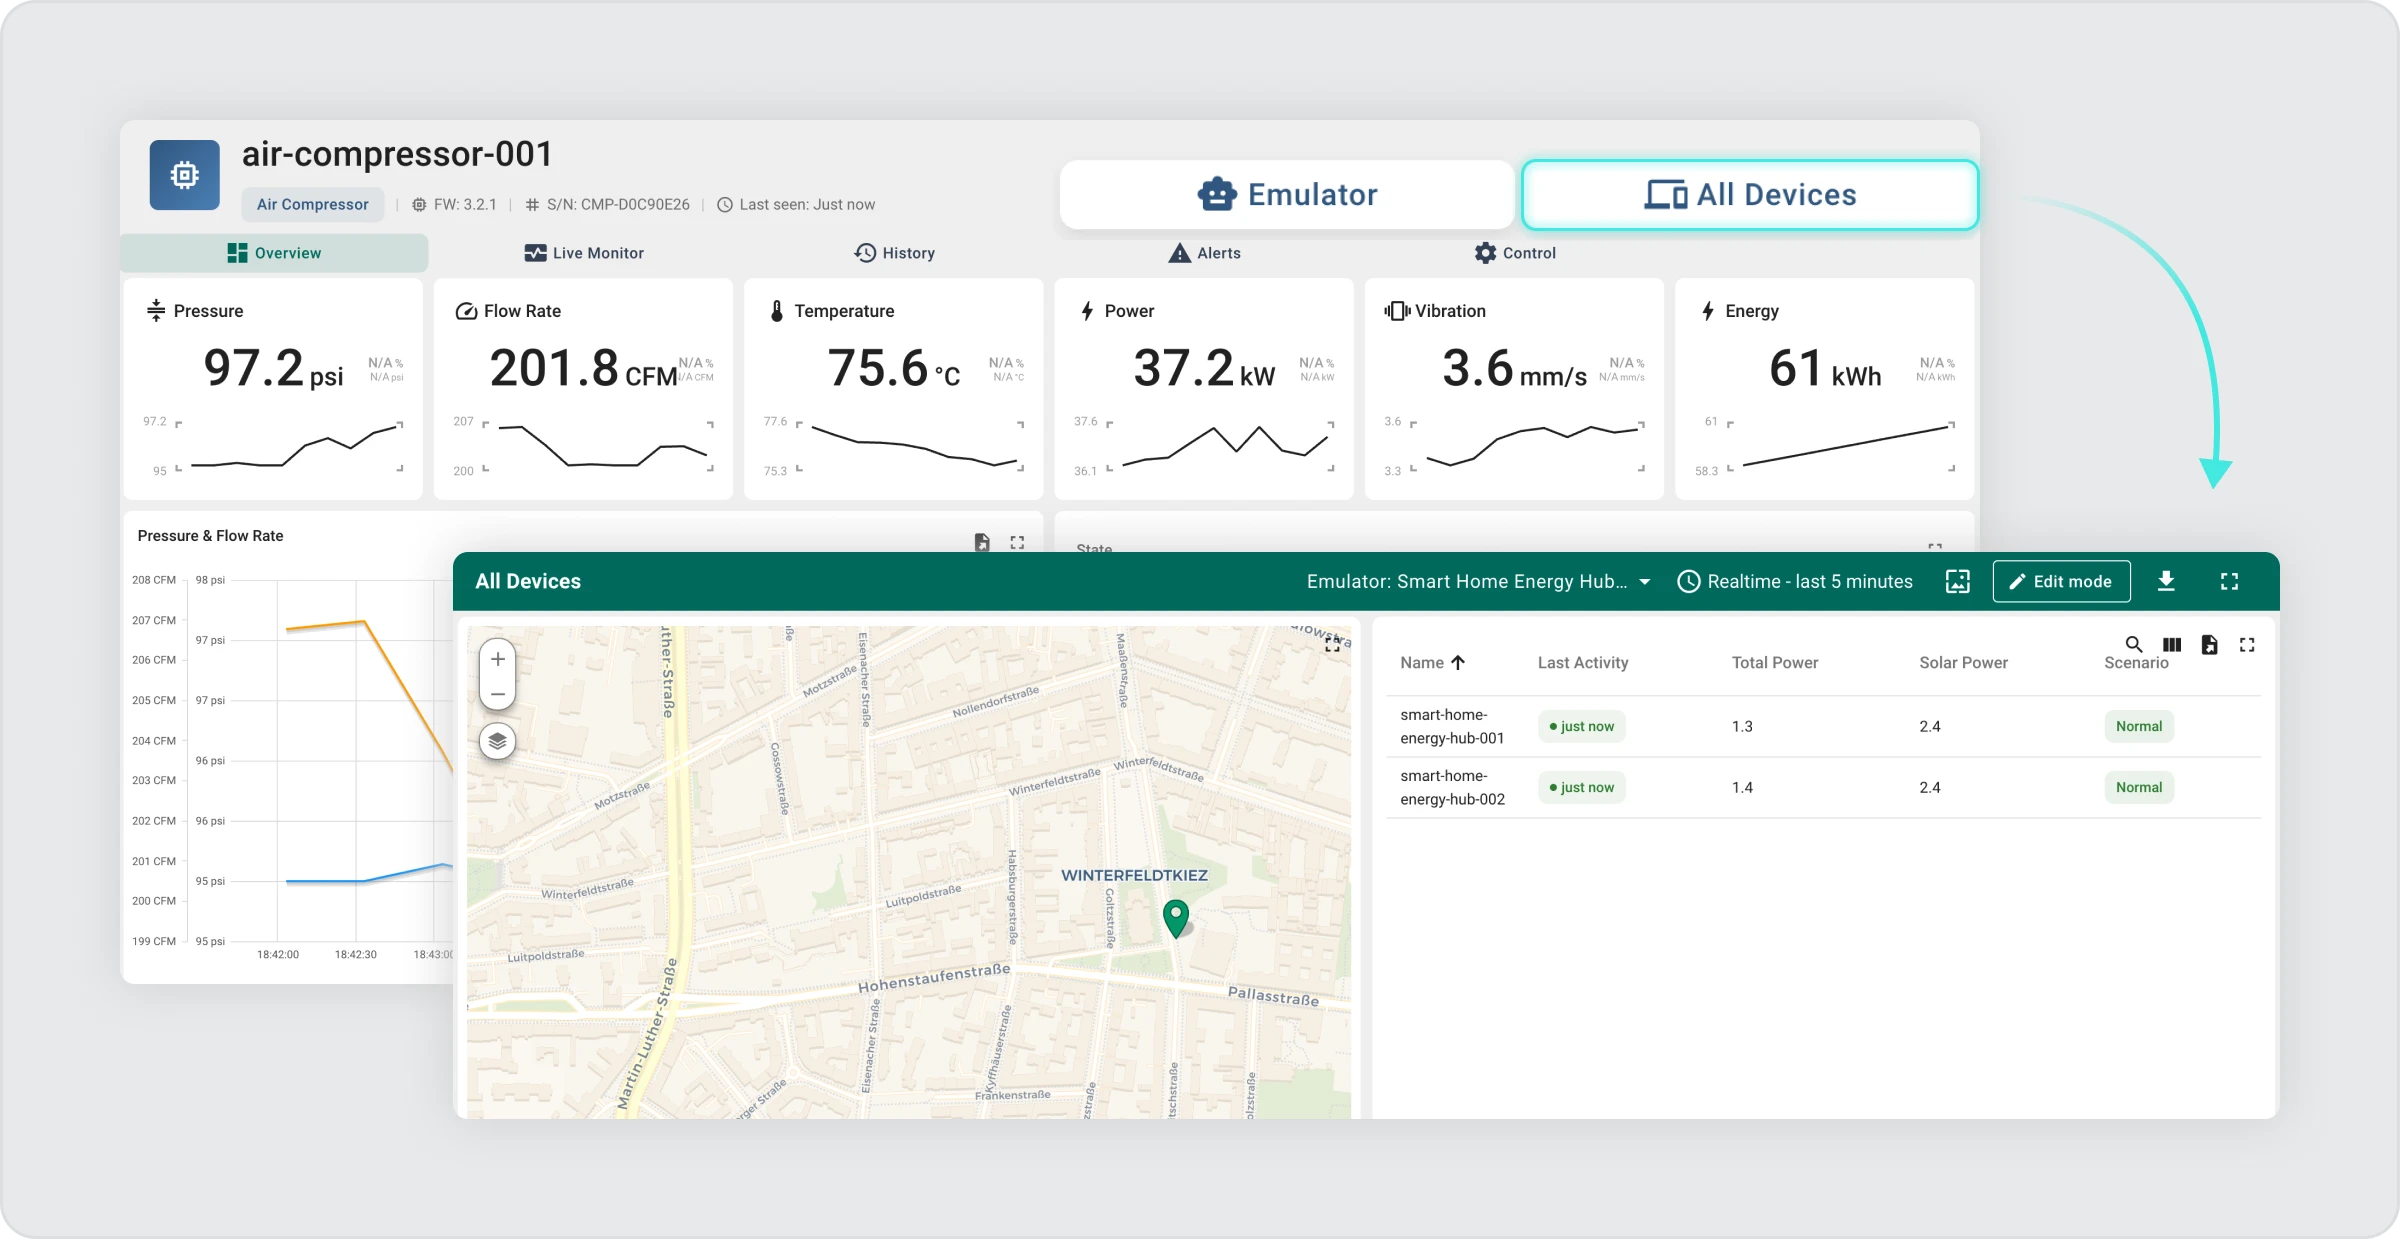
- You can view and switch between multiple devices on the shared dashboard
This means one dashboard can serve many virtual devices of the same type simultaneously.
Click “All devices” to see how many devices are connected to the dashboard.
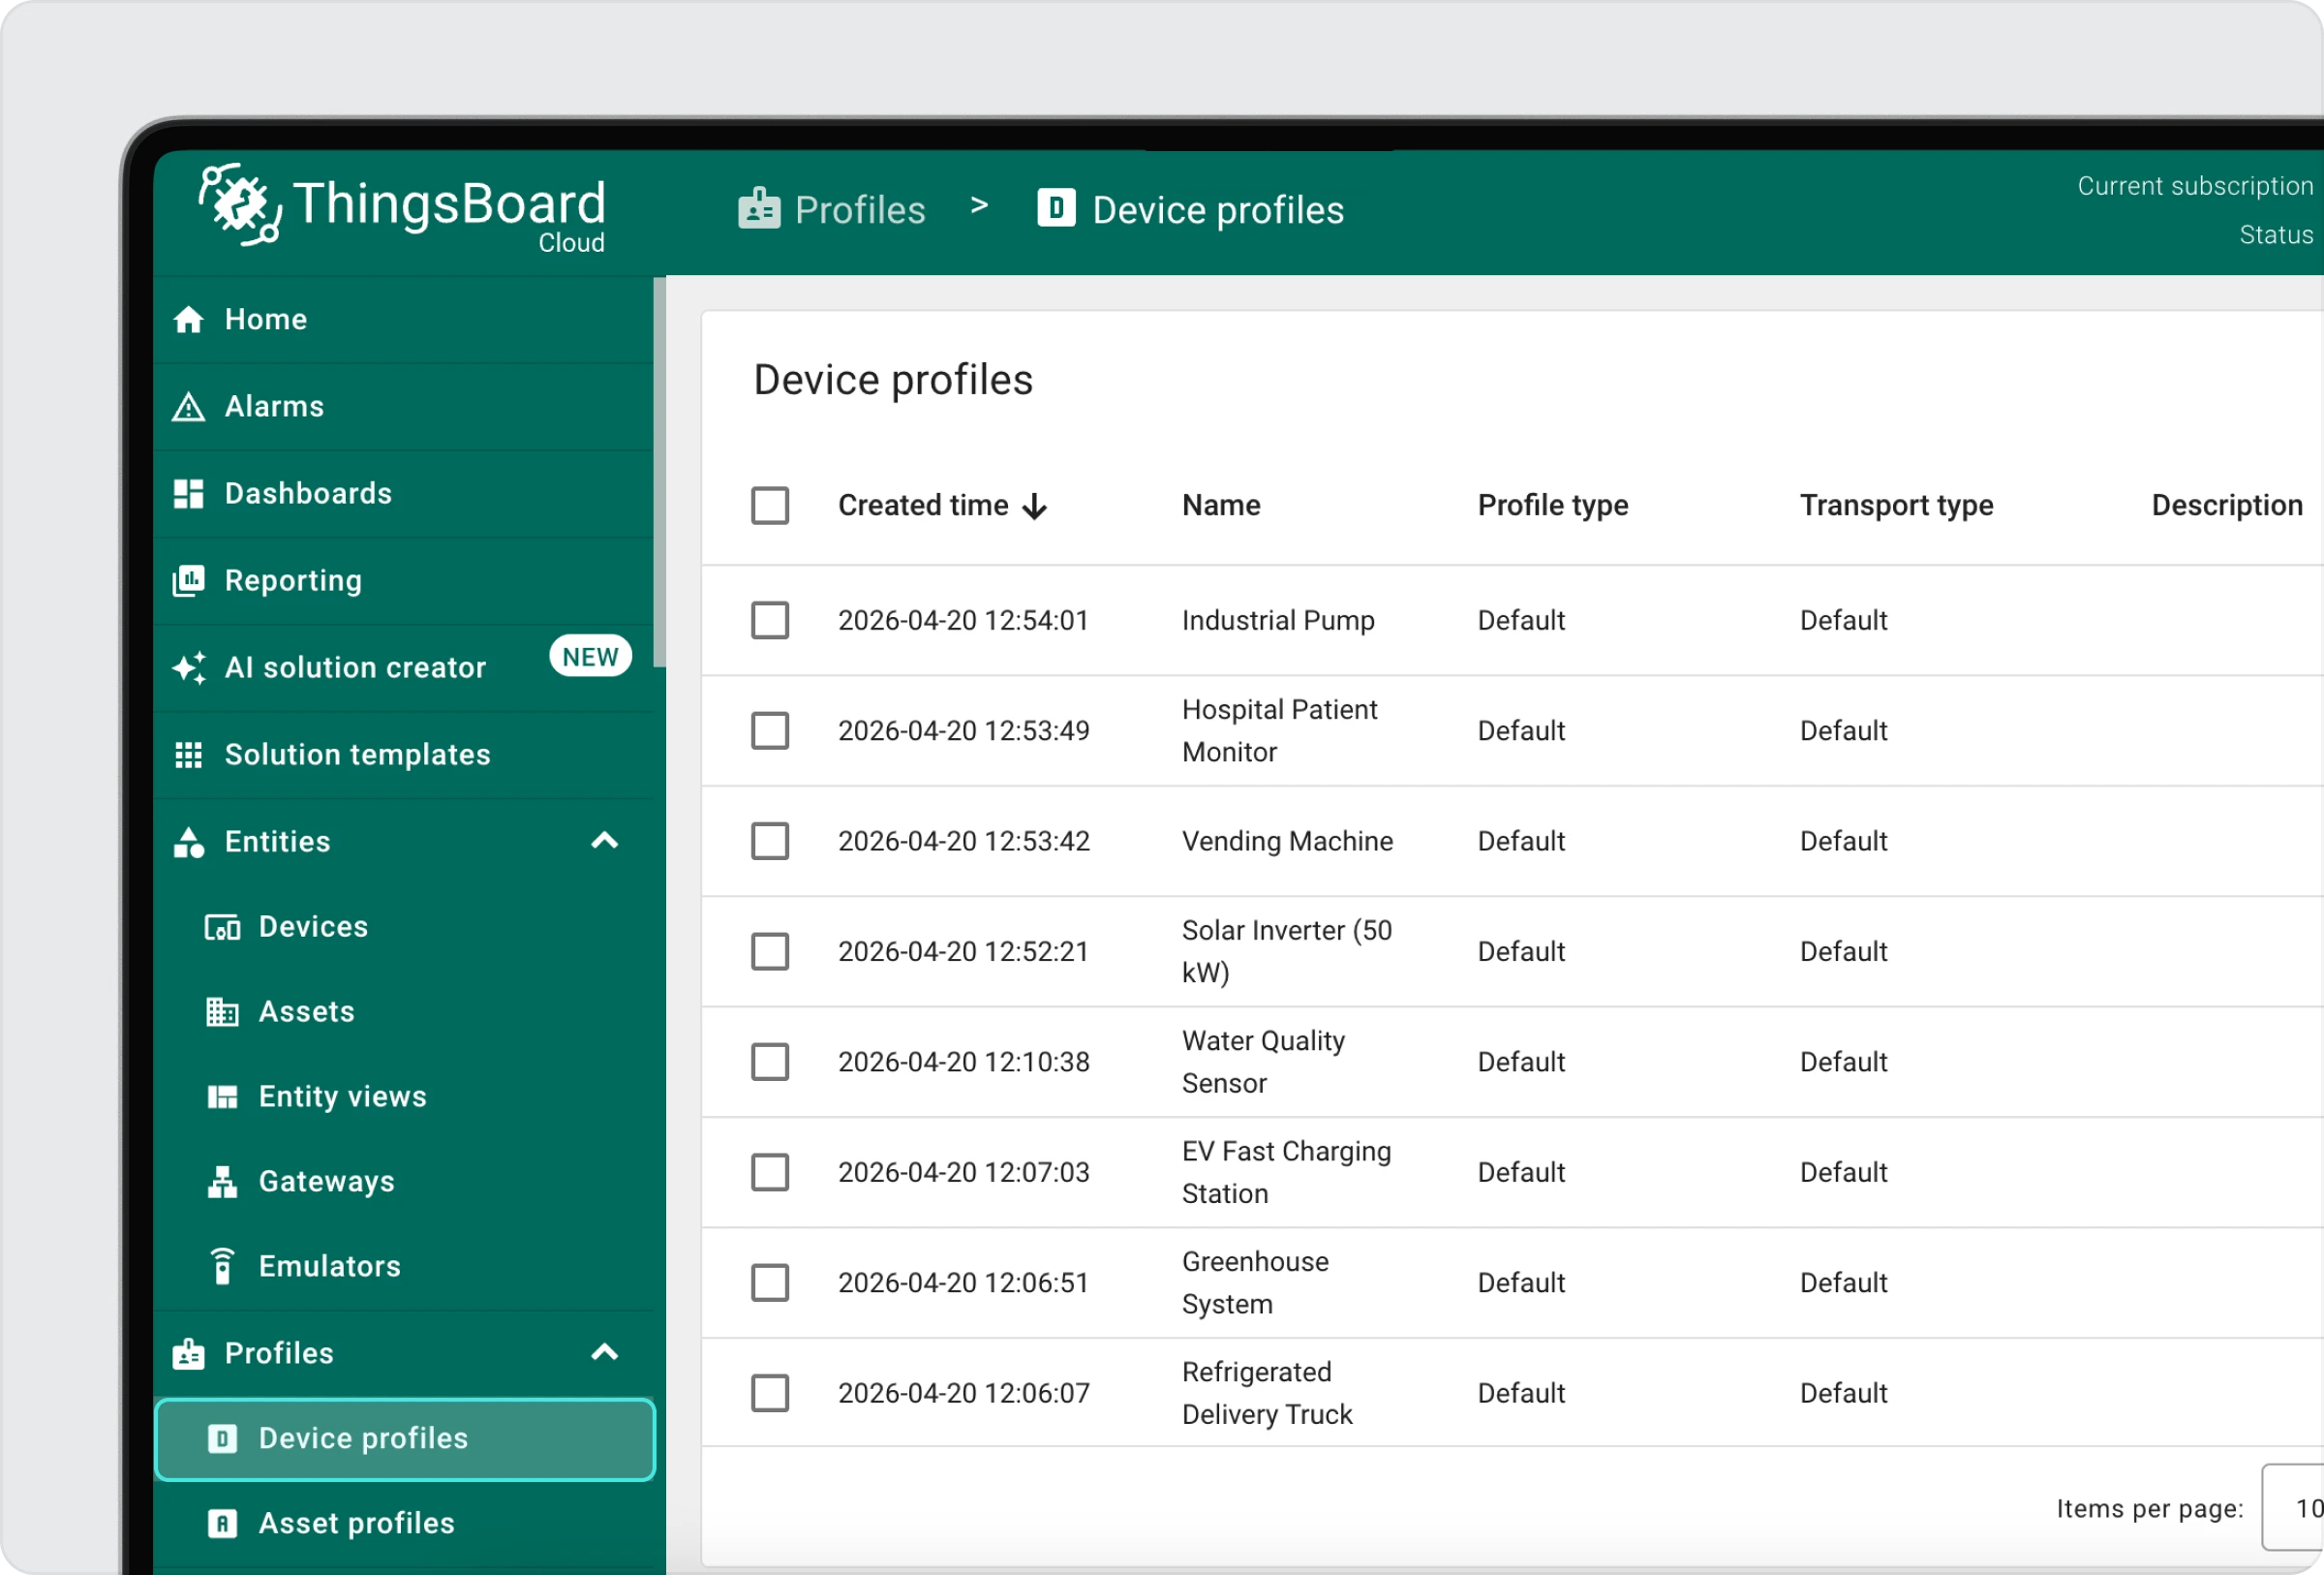
Device Profile
When you create your first emulator of a particular device type, ThingsBoard automatically creates a Device Profile for it. This profile acts as a template that defines how devices of that type behave on the platform. You do not need to configure it manually.
A Note on Deleting Telemetry Keys
If you manually delete a telemetry key from a device (for example, removing the latest value of a specific sensor reading), the corresponding chart in the Live Monitor section of the dashboard will stop displaying data for that key.
The chart widget will remain on the dashboard, but it will appear empty until new data for that key is received from the device.
Creating Multiple Devices at Once
If you need to simulate scale — for example, to test how ThingsBoard handles 5 devices reporting simultaneously — use Bulk Creation.
To create multiple devices at once:
- In the Emulator Catalog, select the emulator profile.
- Specify the number of emulators to create and the shared settings (scenario, telemetry rate).
- Choose the Create Bulk option.
- Confirm the bulk creation.
If capacity limits are reached, any remaining emulators are skipped, and you’ll see a notification explaining why.
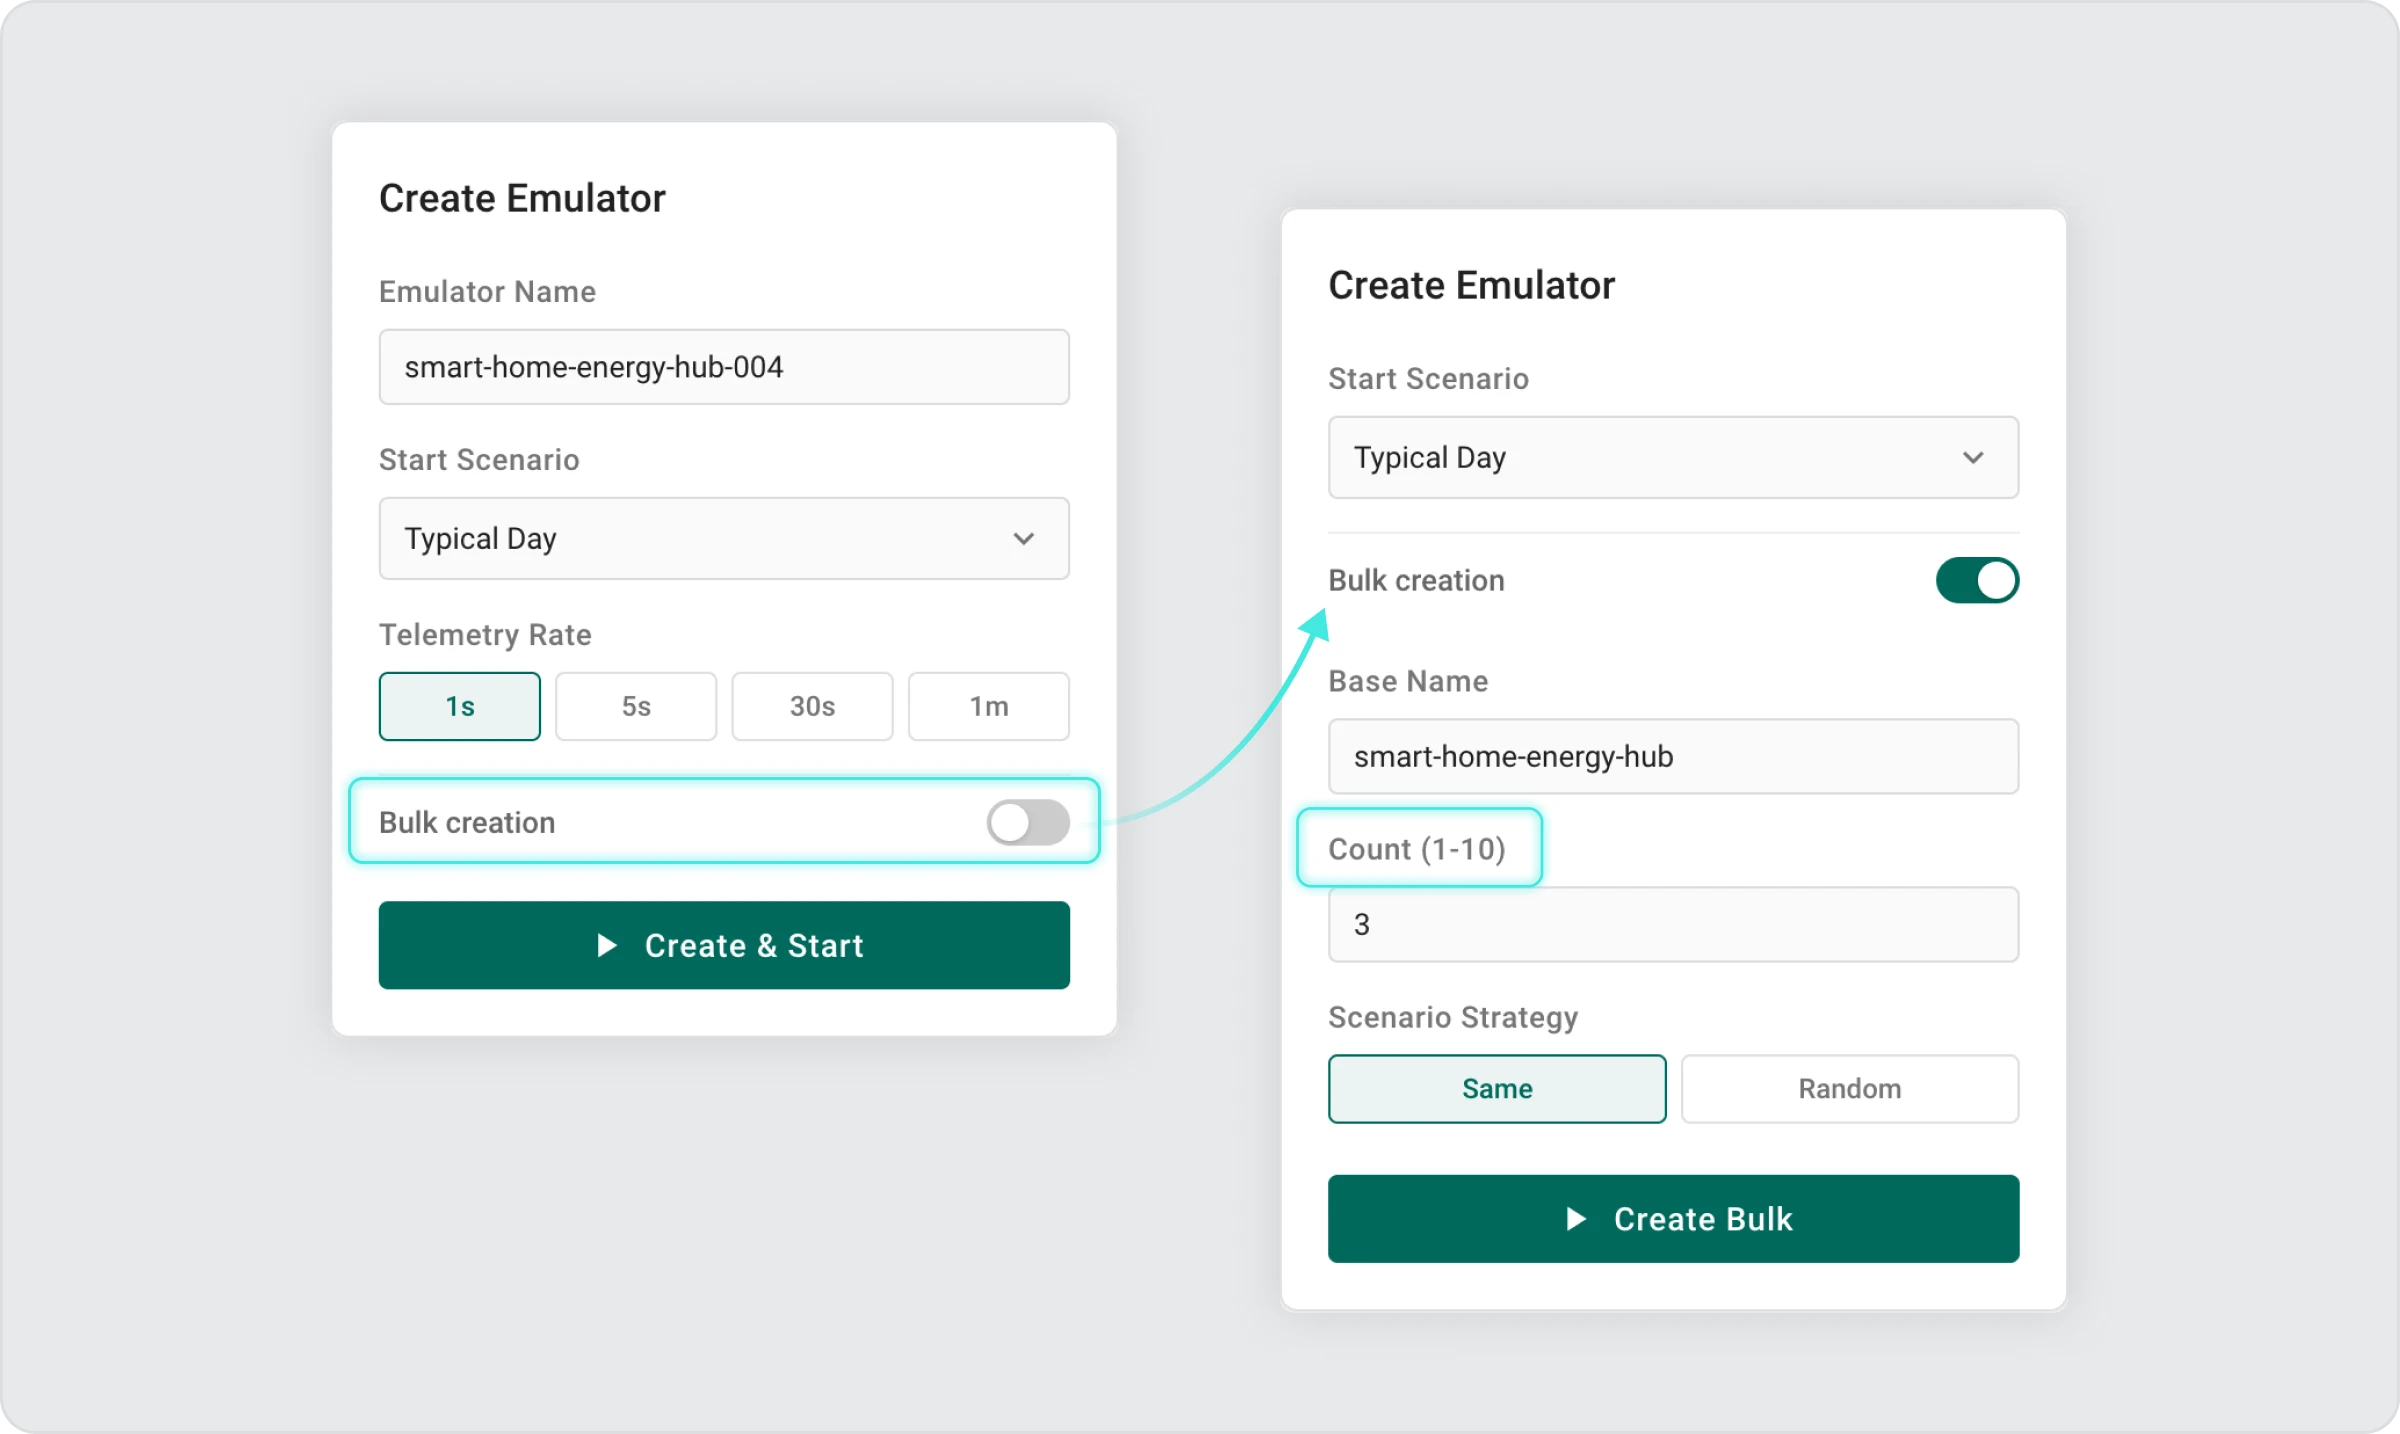
Important: Bulk creation requires a minimum telemetry interval to prevent system overload. If you set the interval too fast (under 30 seconds), the system will ask you to increase it before proceeding.
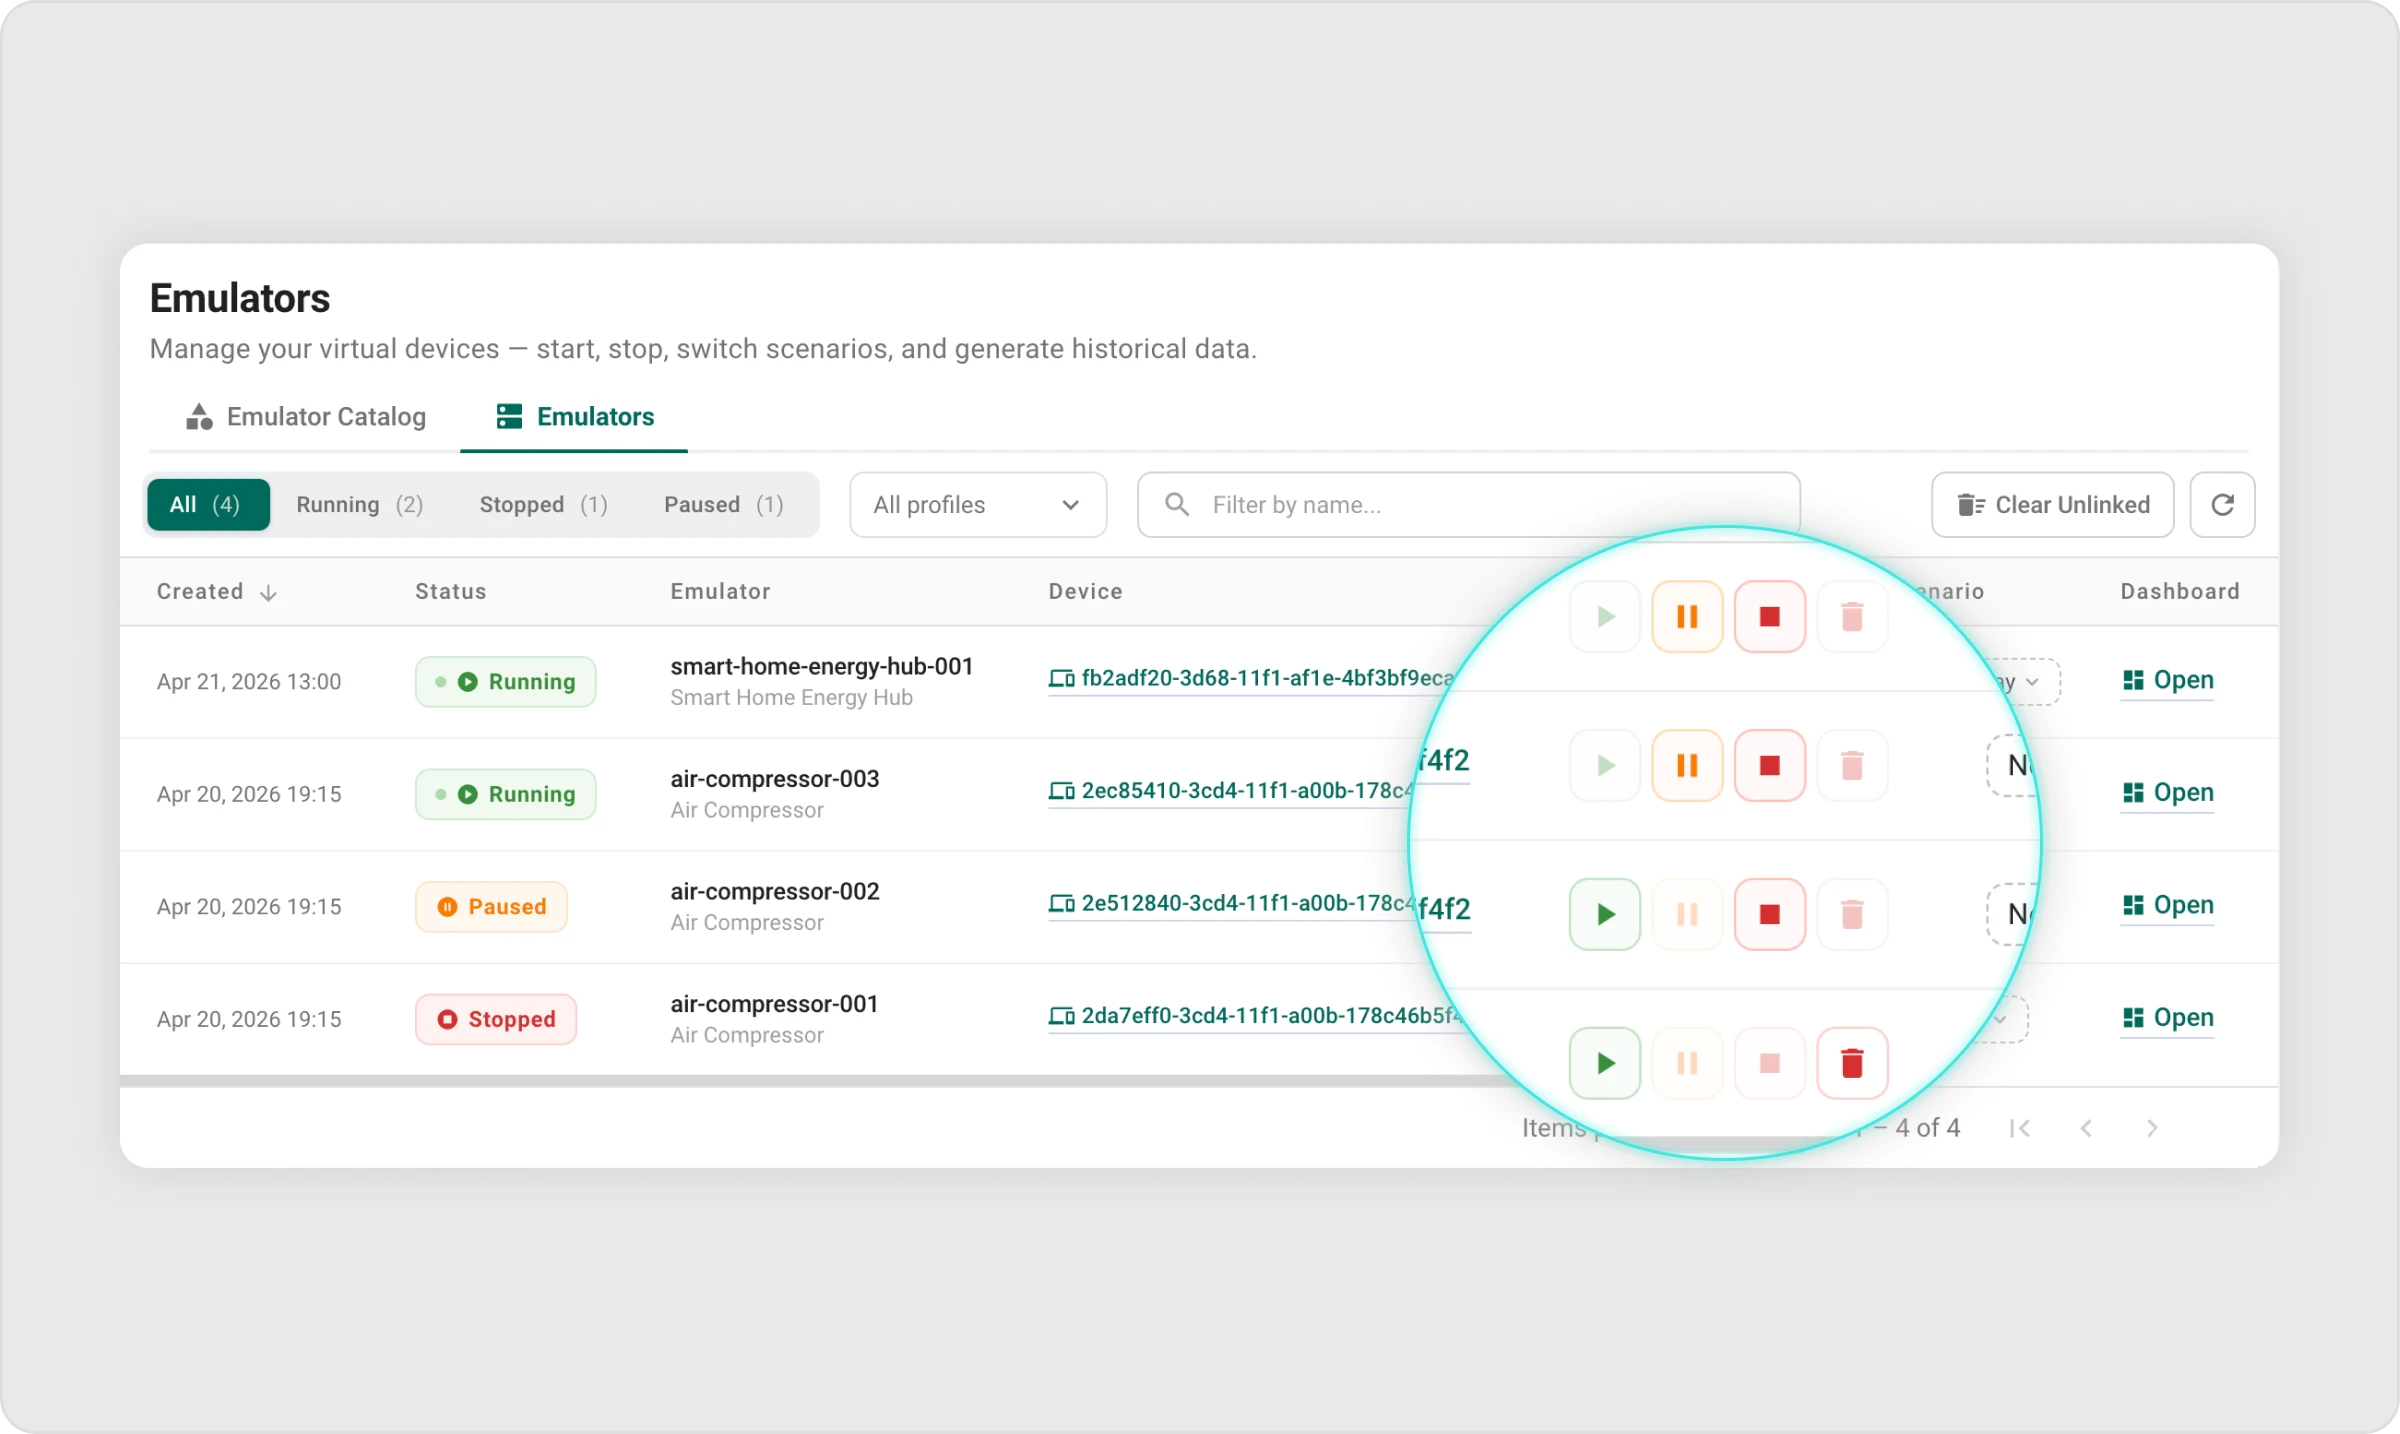
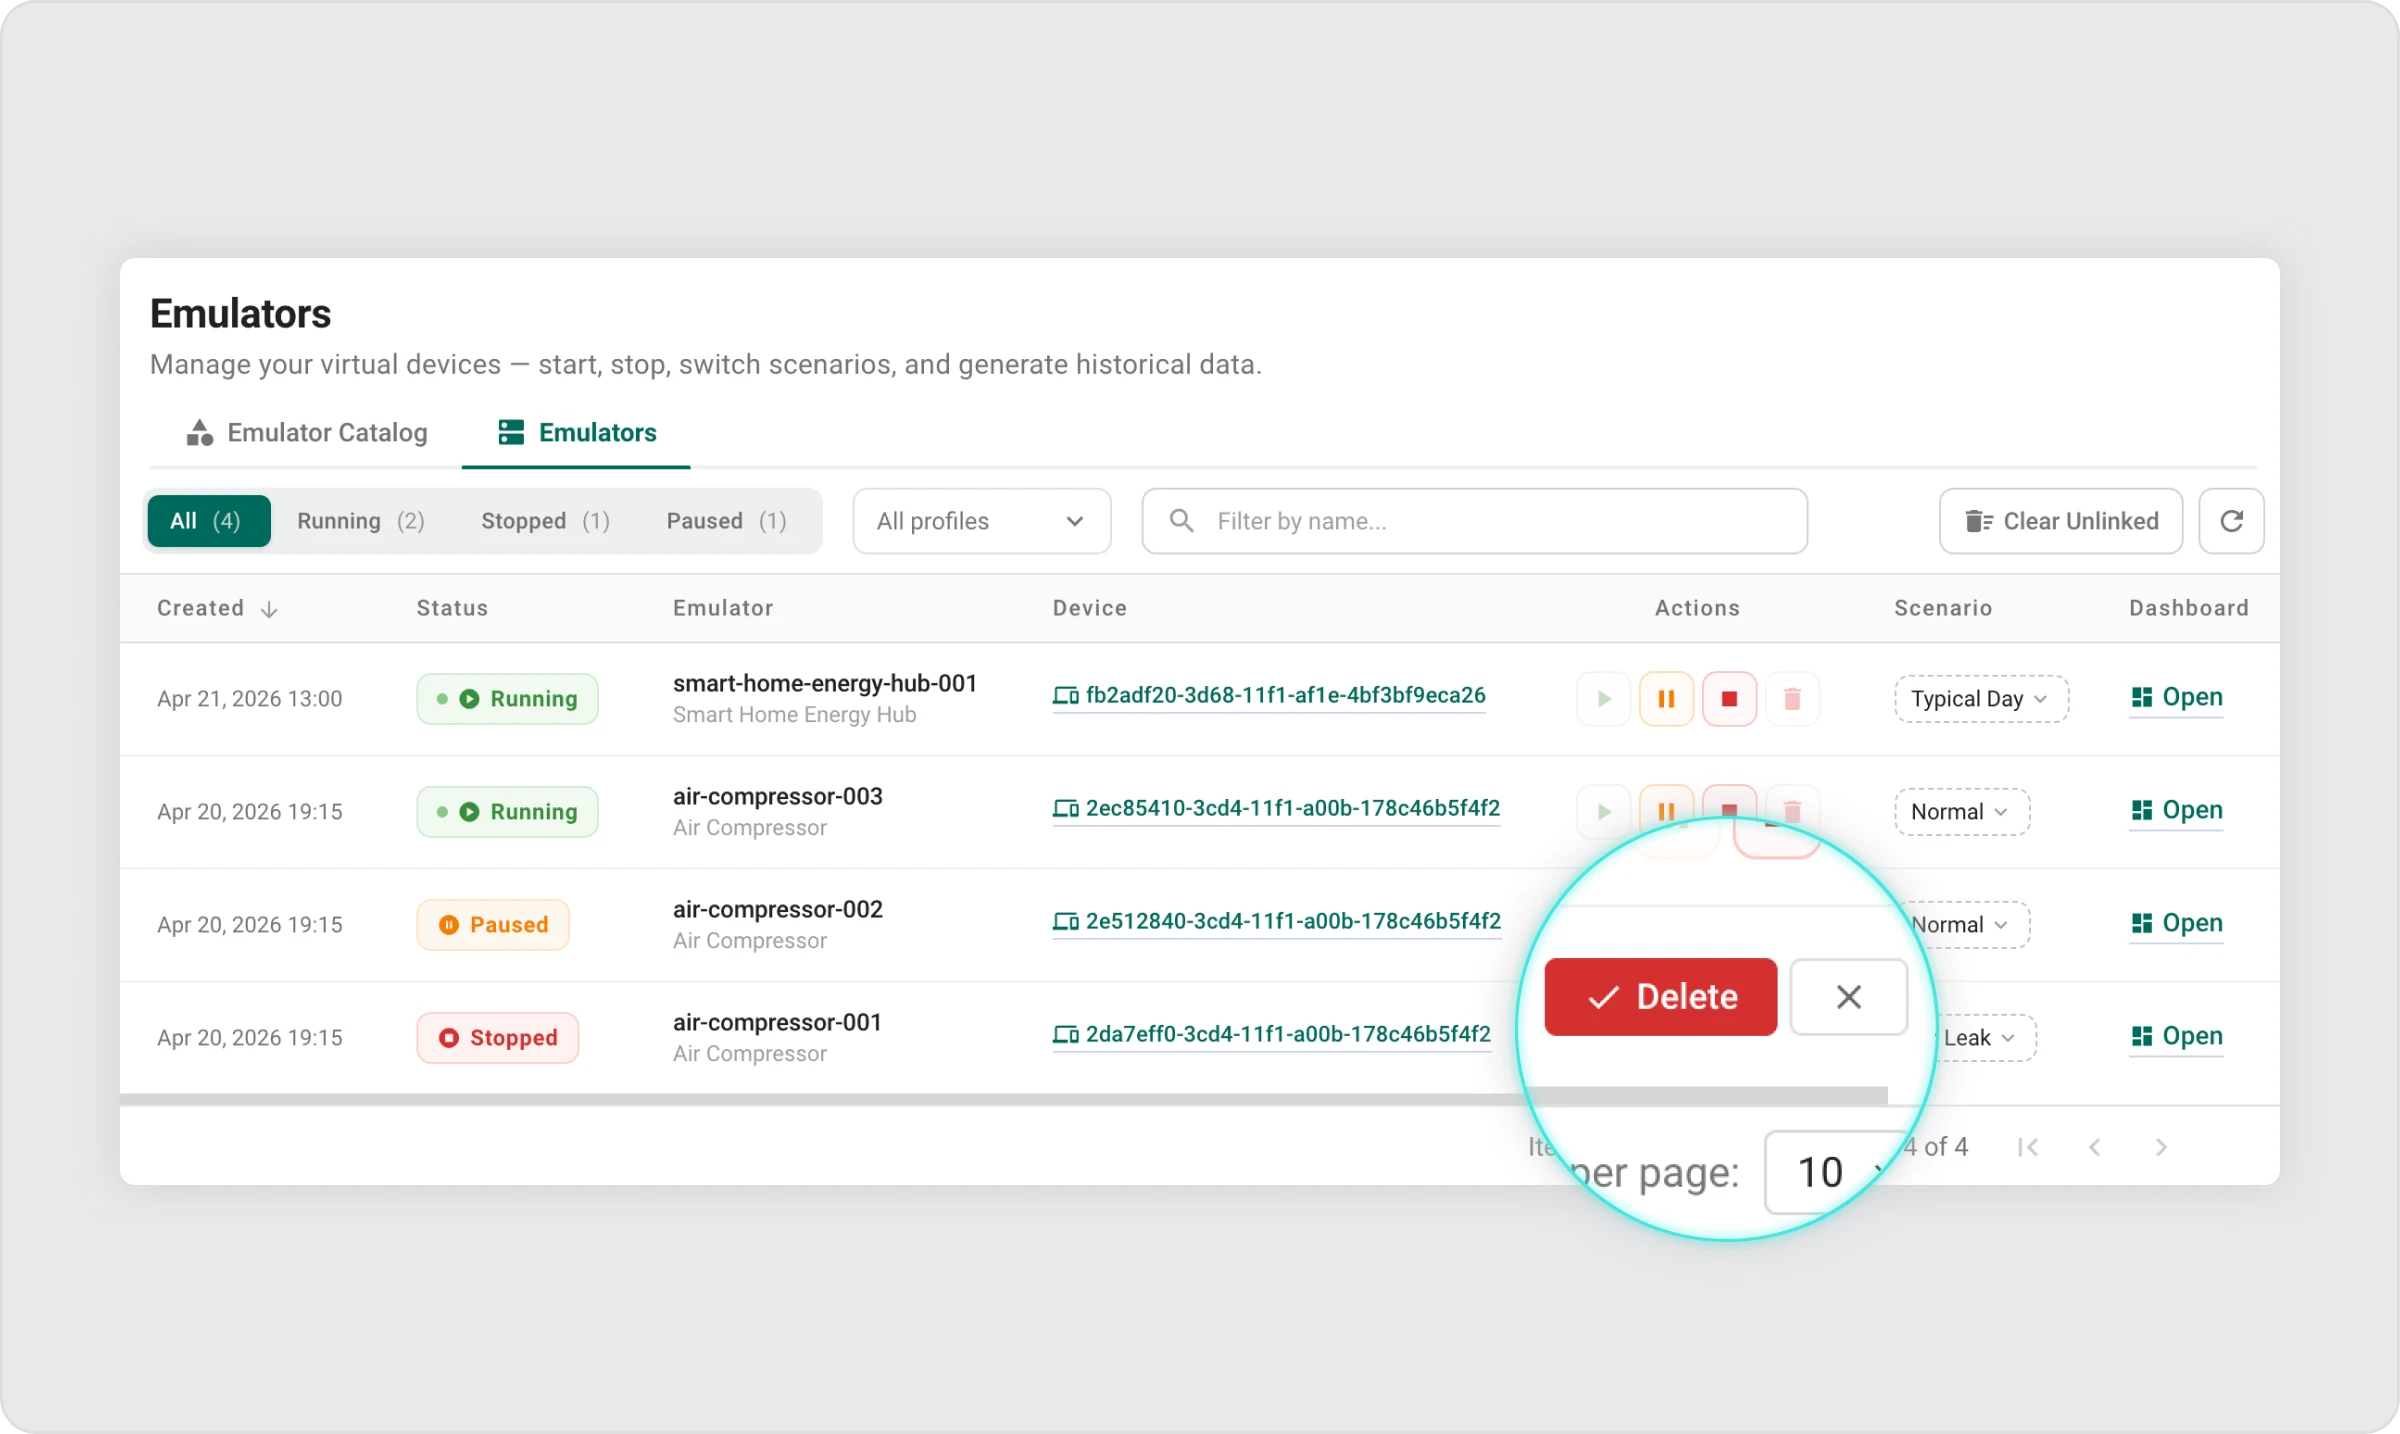
Viewing and Managing Your Devices
All your virtual devices are displayed in the Emulators List on the Emulators page. This is your central overview of everything that is currently running, paused, or stopped in your account.
For each device, the Emulators Catalog shows the following information:
- When the emulator was created
- The current state of the device: Running, Paused, or Stopped
- The name assigned to the device at creation or updated afterward
- Link to a real device created in ThingsBoard
- Controls to Start, Pause, Stop, or Delete the emulator
- The behavioral scenario that the device is currently simulating
- How frequently the device is sending telemetry data
- The timestamp of the most recent data update from the device
- A quick access link to view the historical data for that device
- A direct link to open the device’s individual dashboard
You can filter the list by name to quickly locate a specific device when managing multiple emulators at once.
Device Statuses Explained
| Status | What it means |
| Running | The device is active and sending telemetry data to ThingsBoard. |
| Paused | The device is temporarily stopped. Data is not being sent, but the emulator still exists and can be resumed. |
| Stopped | The device has been fully stopped. It still appears in the list and can be restarted. |
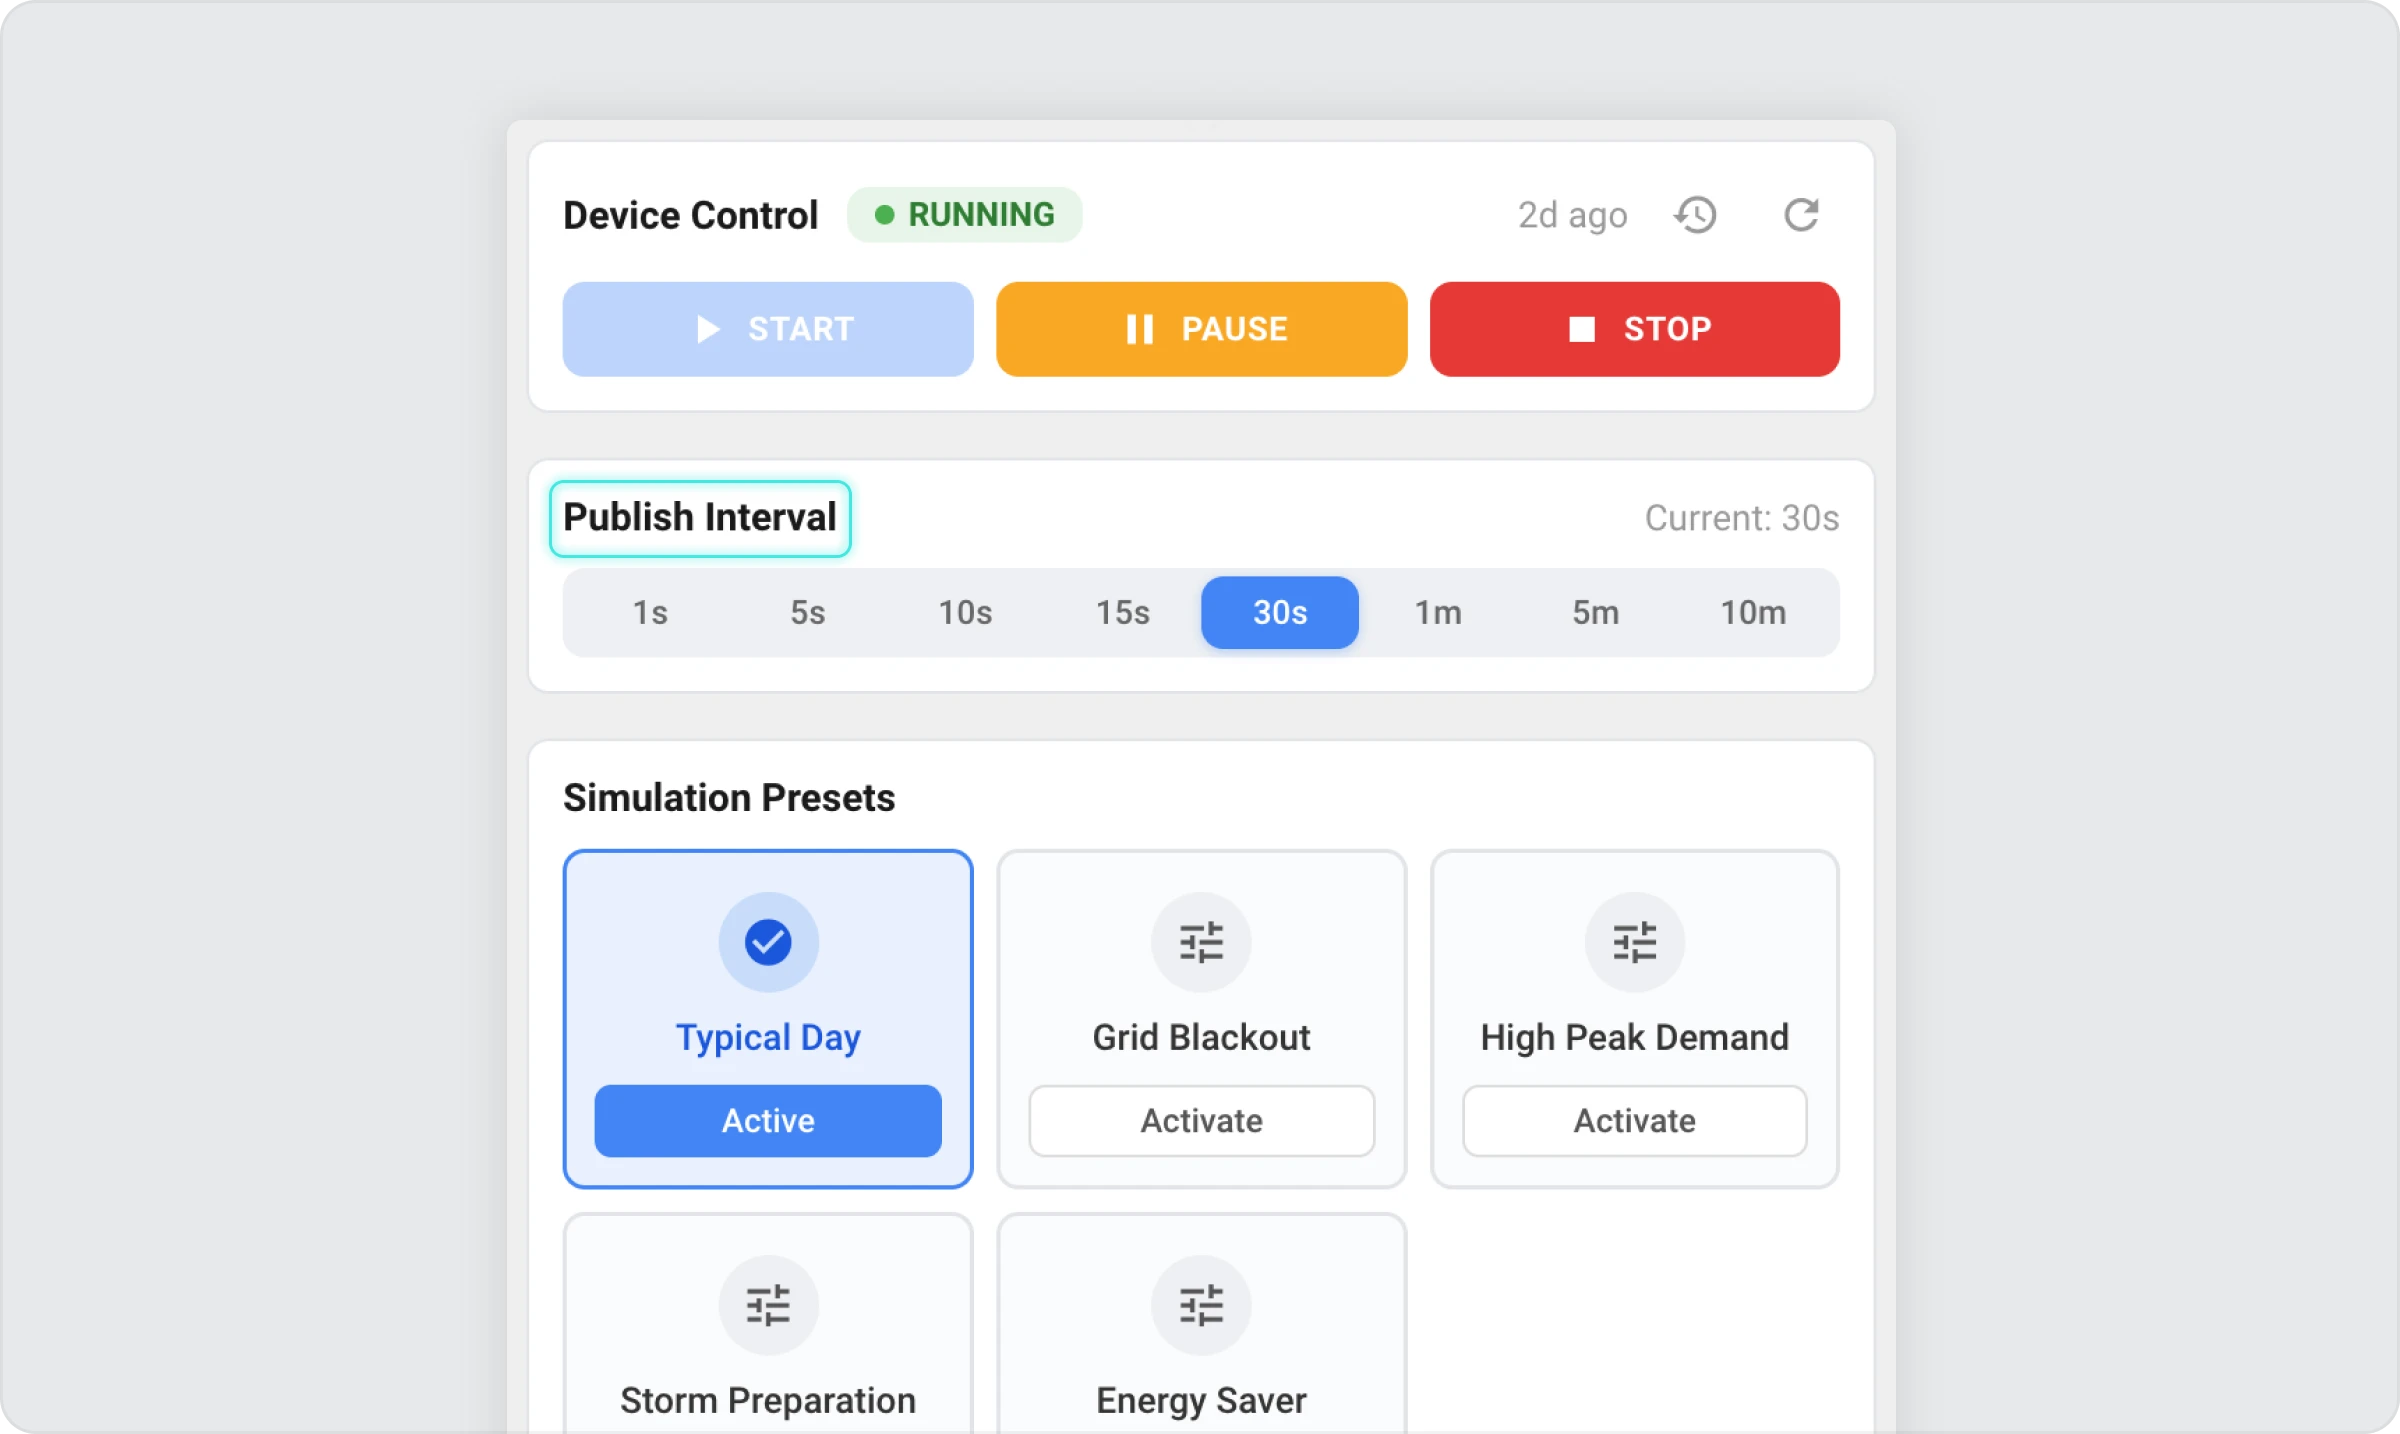
Controlling a Running Device
Once a device is running, you can change its behavior in real time from the Control Tab on its dashboard.
Switching Scenarios
This is one of the most powerful features of the emulator. Switching the scenario instantly changes what the device reports — without interrupting the data stream or restarting anything.
Some example scenarios for a cold storage device:
| Scenario | What It Simulates |
| Normal | Standard operating conditions |
| Frozen | Consistent low-temperature readings |
| Chilled | Moderately low temperature |
| Door Left Open | Unusual temperature rise |
| Defrost Cycle | Periodic temperature fluctuations |
| Low Battery | Diminishing battery level |
| Sensor Fault | Error or out-of-range values |
To switch the scenario:
- Open the device dashboard.
- Go to the Emulator Tab.
- Select the desired scenario from the available options.
- The device immediately begins sending data matching the new scenario.
Tip: Use scenario switching to test how ThingsBoard rules and alarms respond to unusual device conditions.
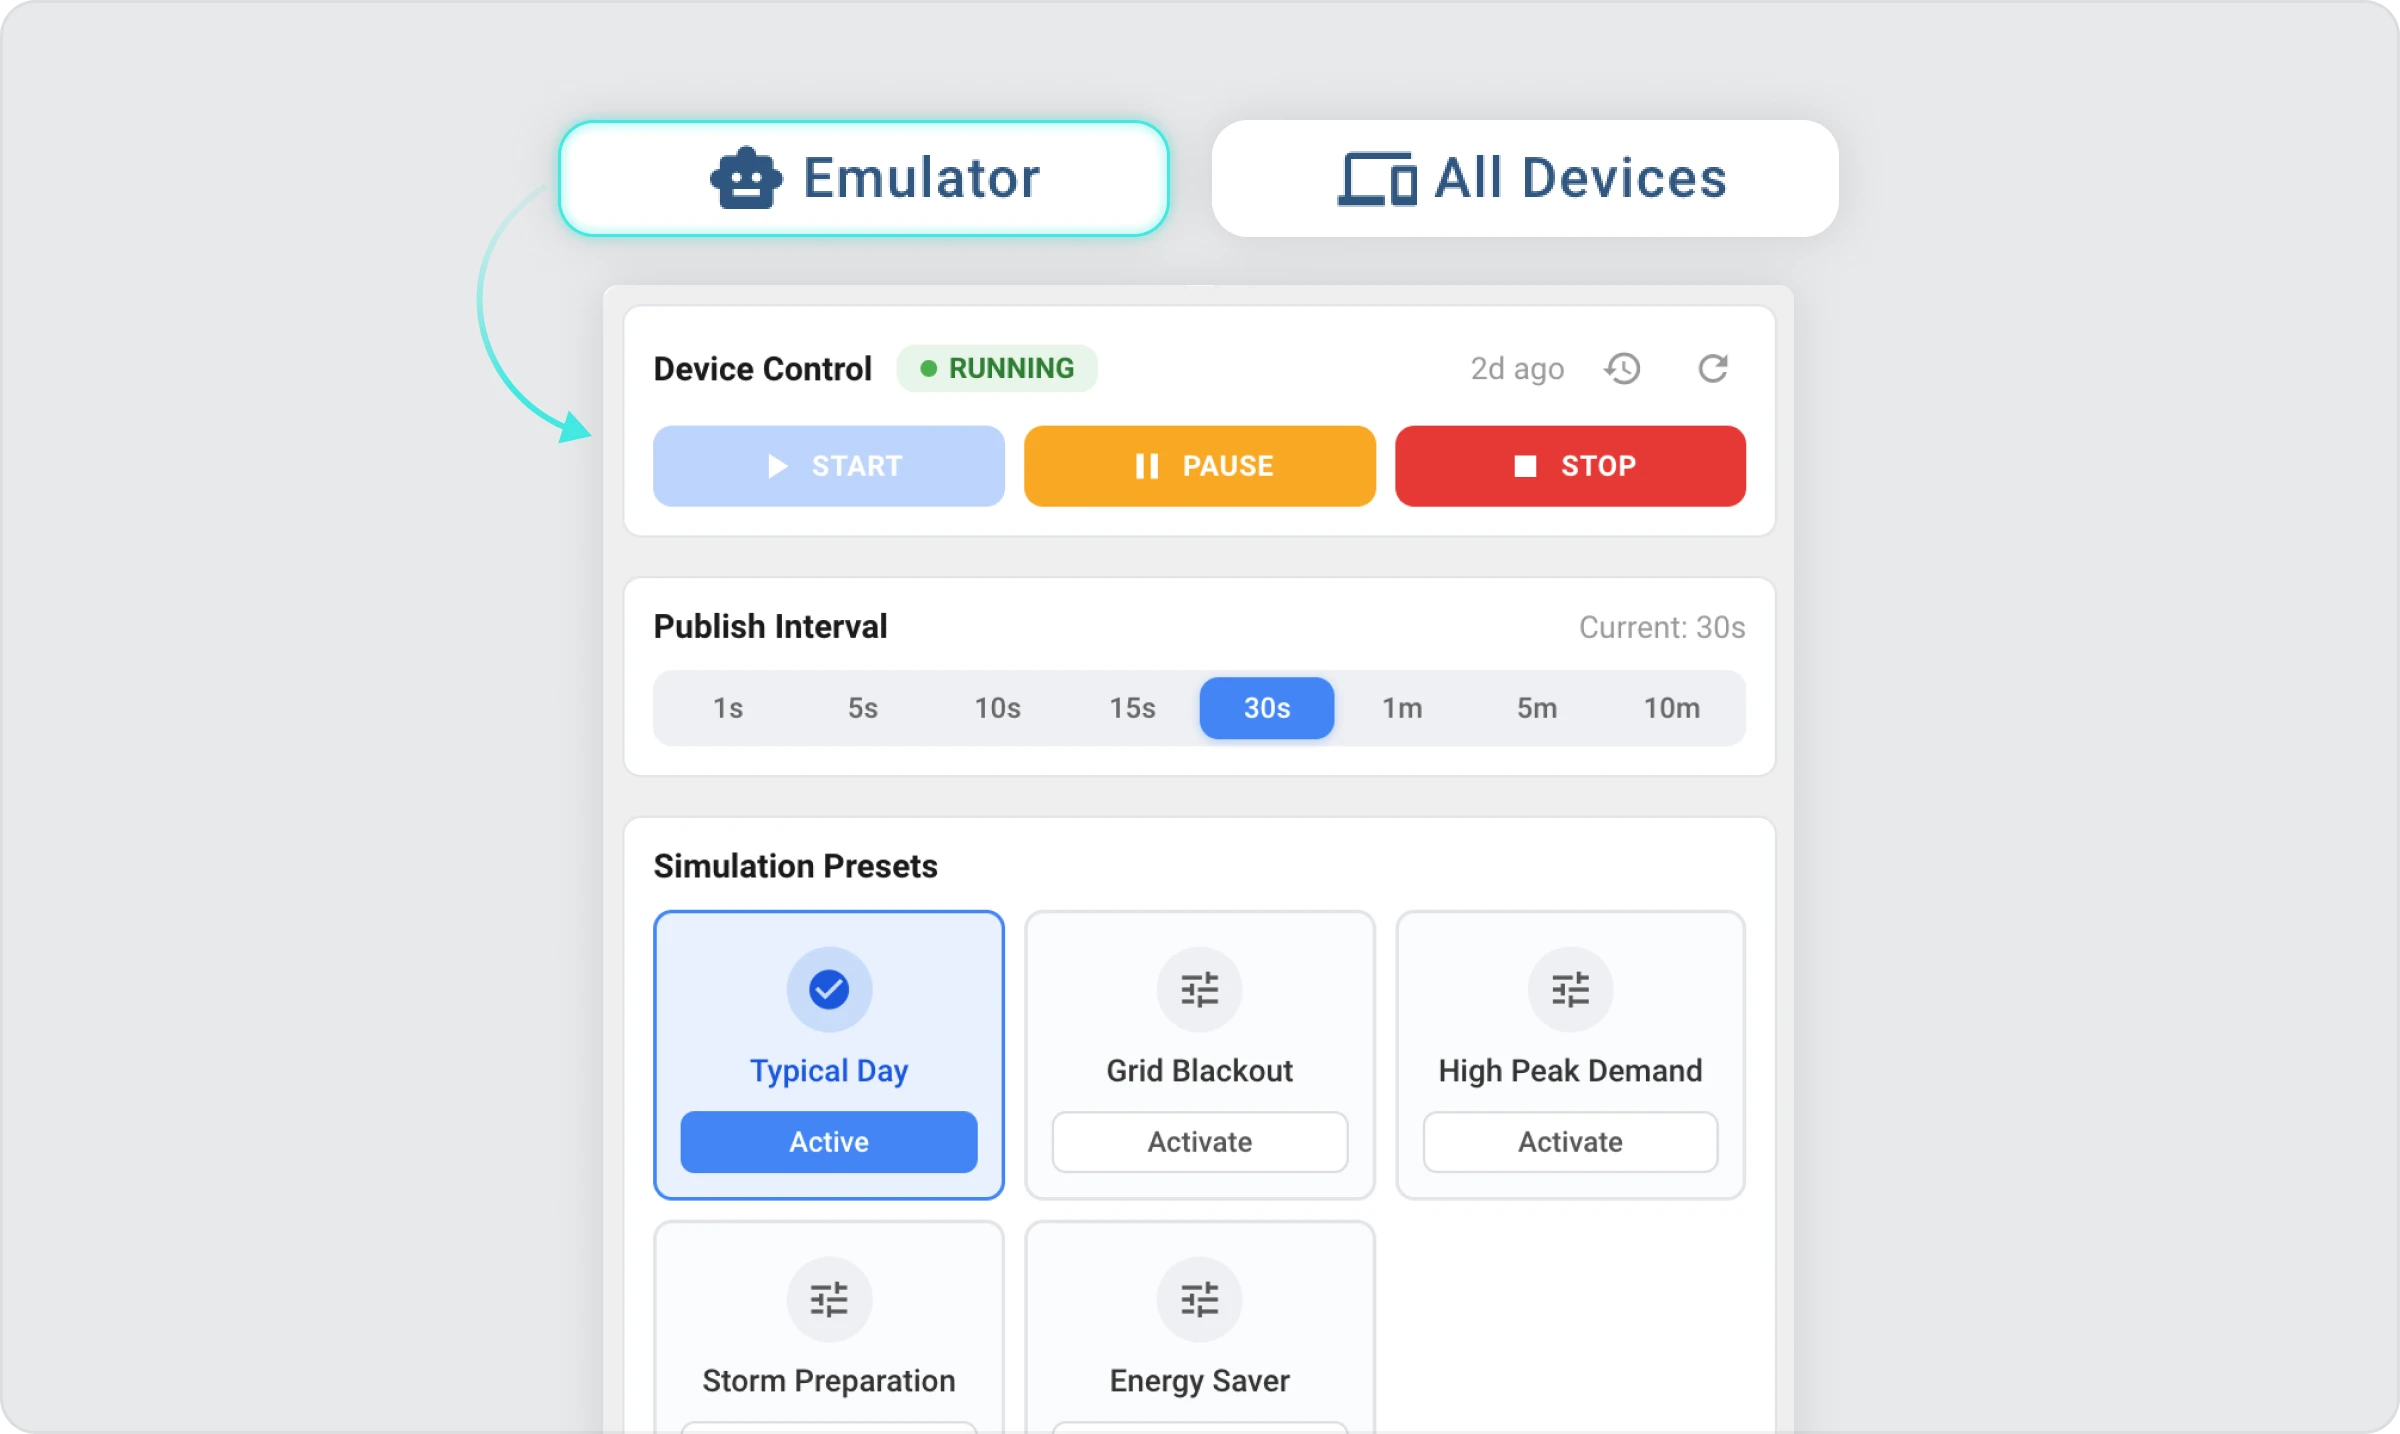
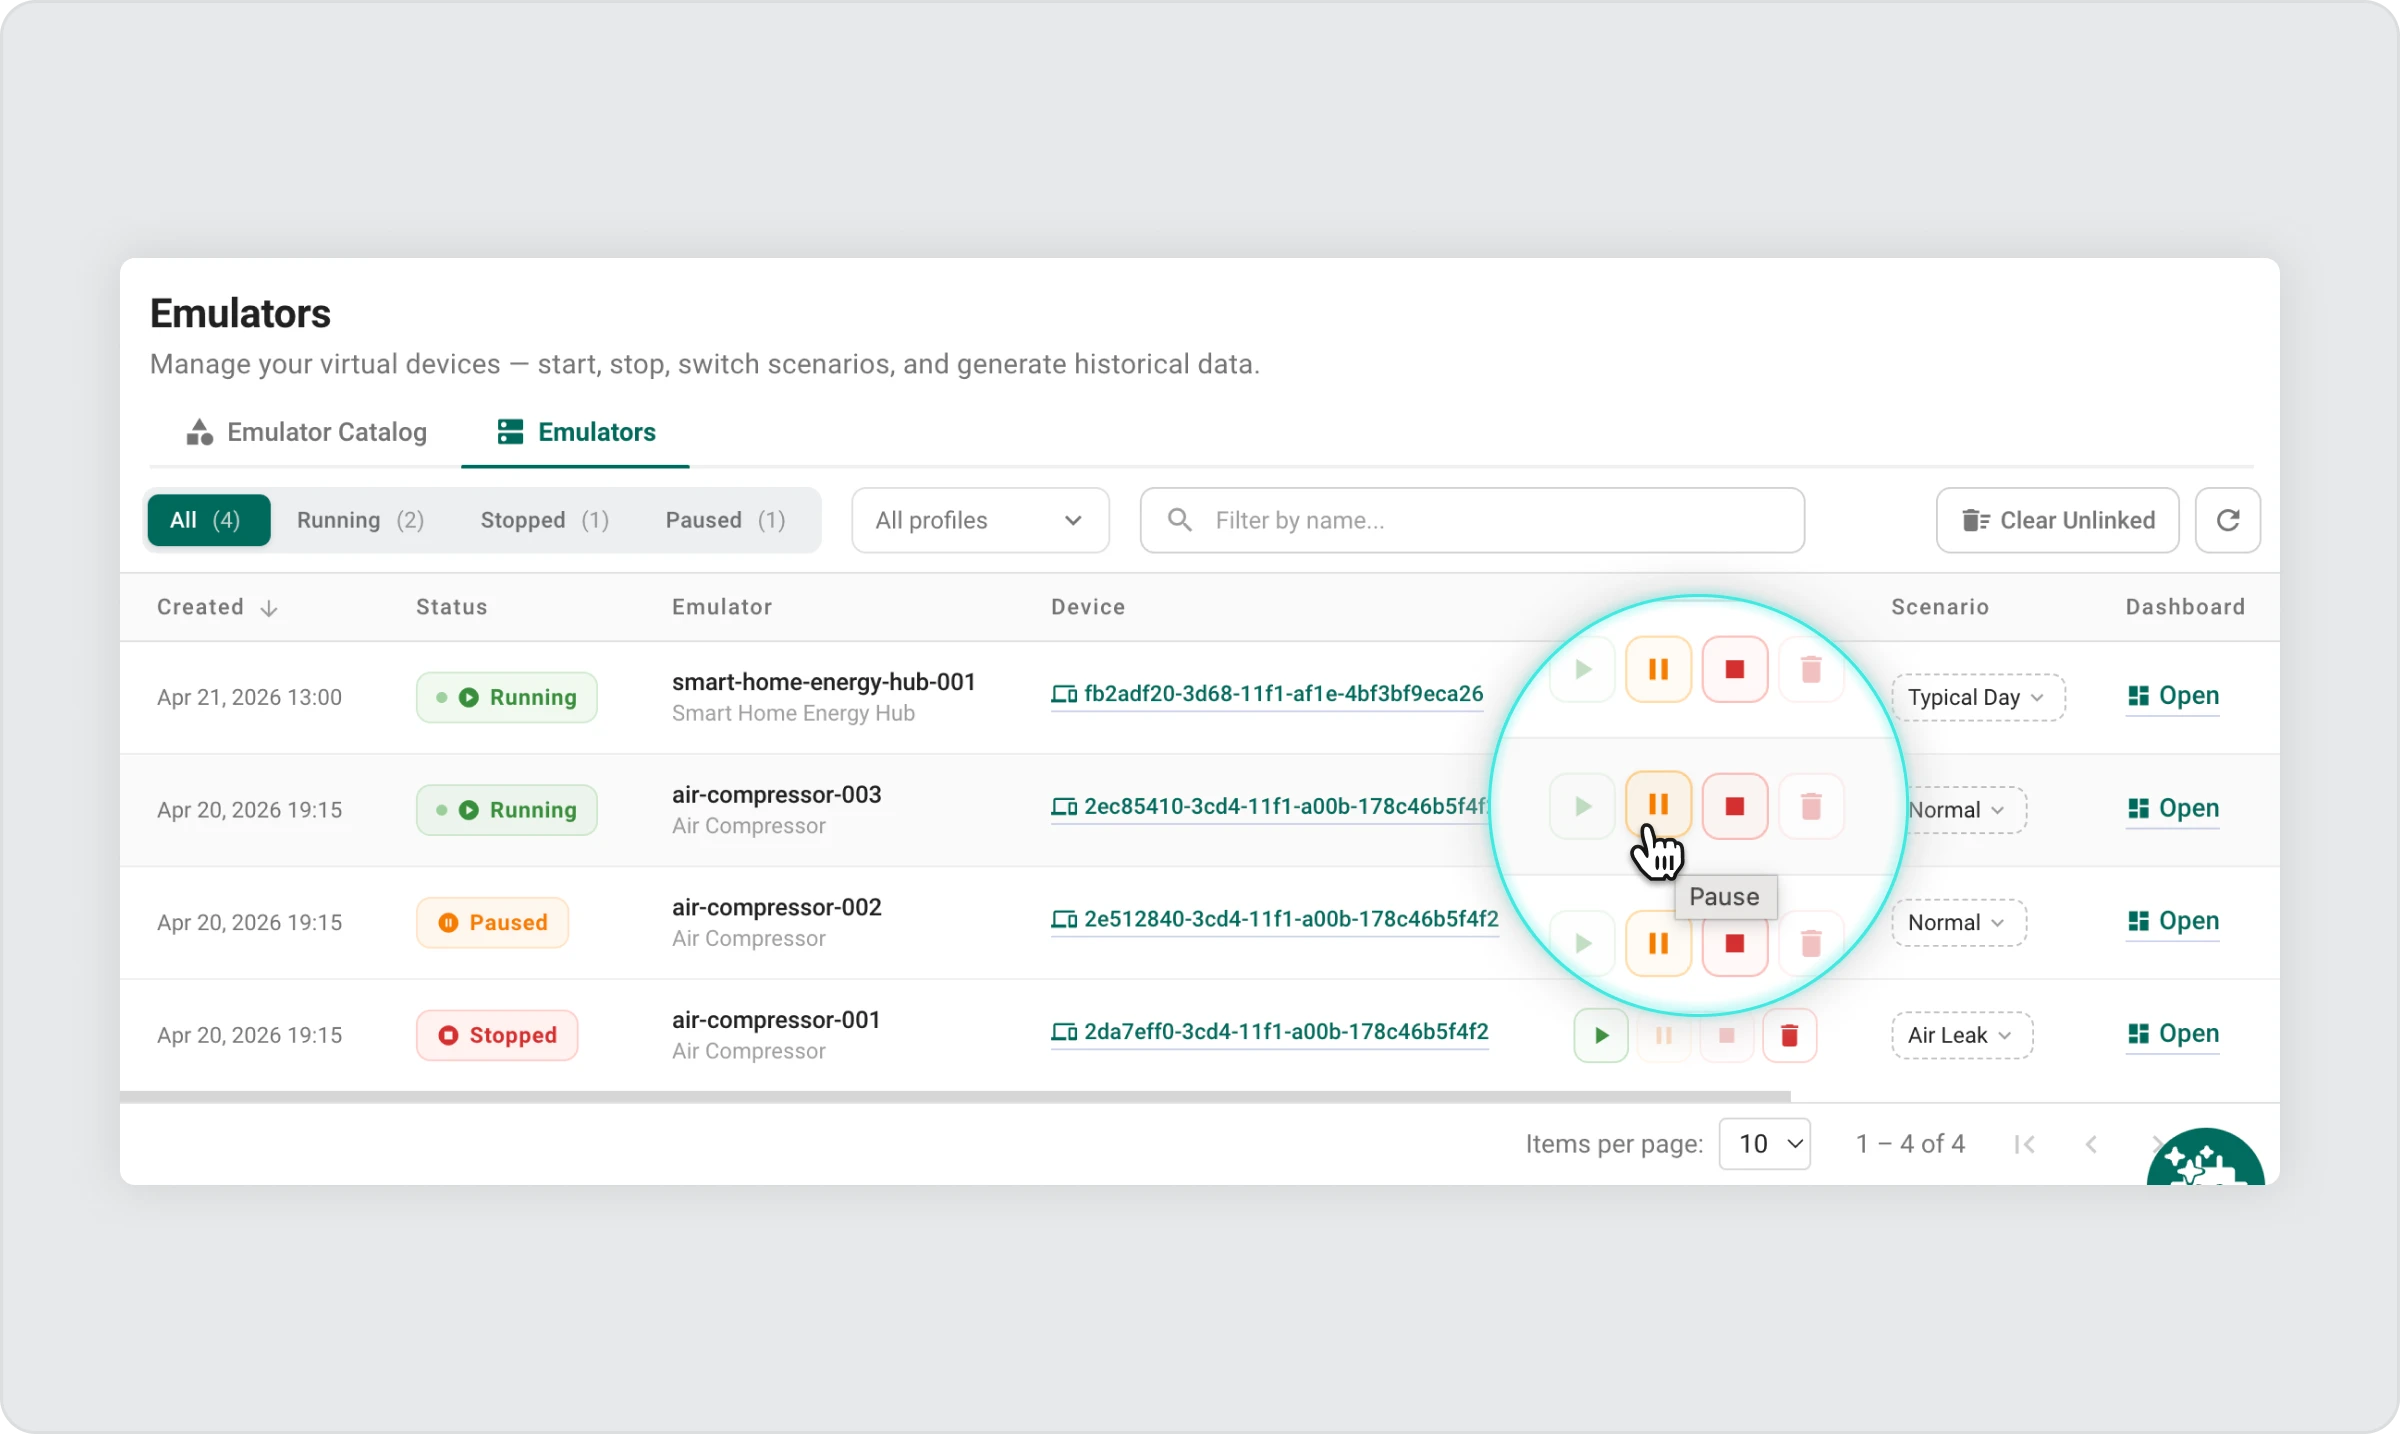
Pausing and Resuming
Pausing a device stops telemetry without removing the emulator. Everything stays configured. Click “Resume” and the data starts flowing again immediately.
This is useful when you want to test how your dashboard or rules behave when a device goes offline temporarily.
Stopping and Restarting
Stopping a device halts all activity completely. The emulator remains in your list and can be started again at any time.
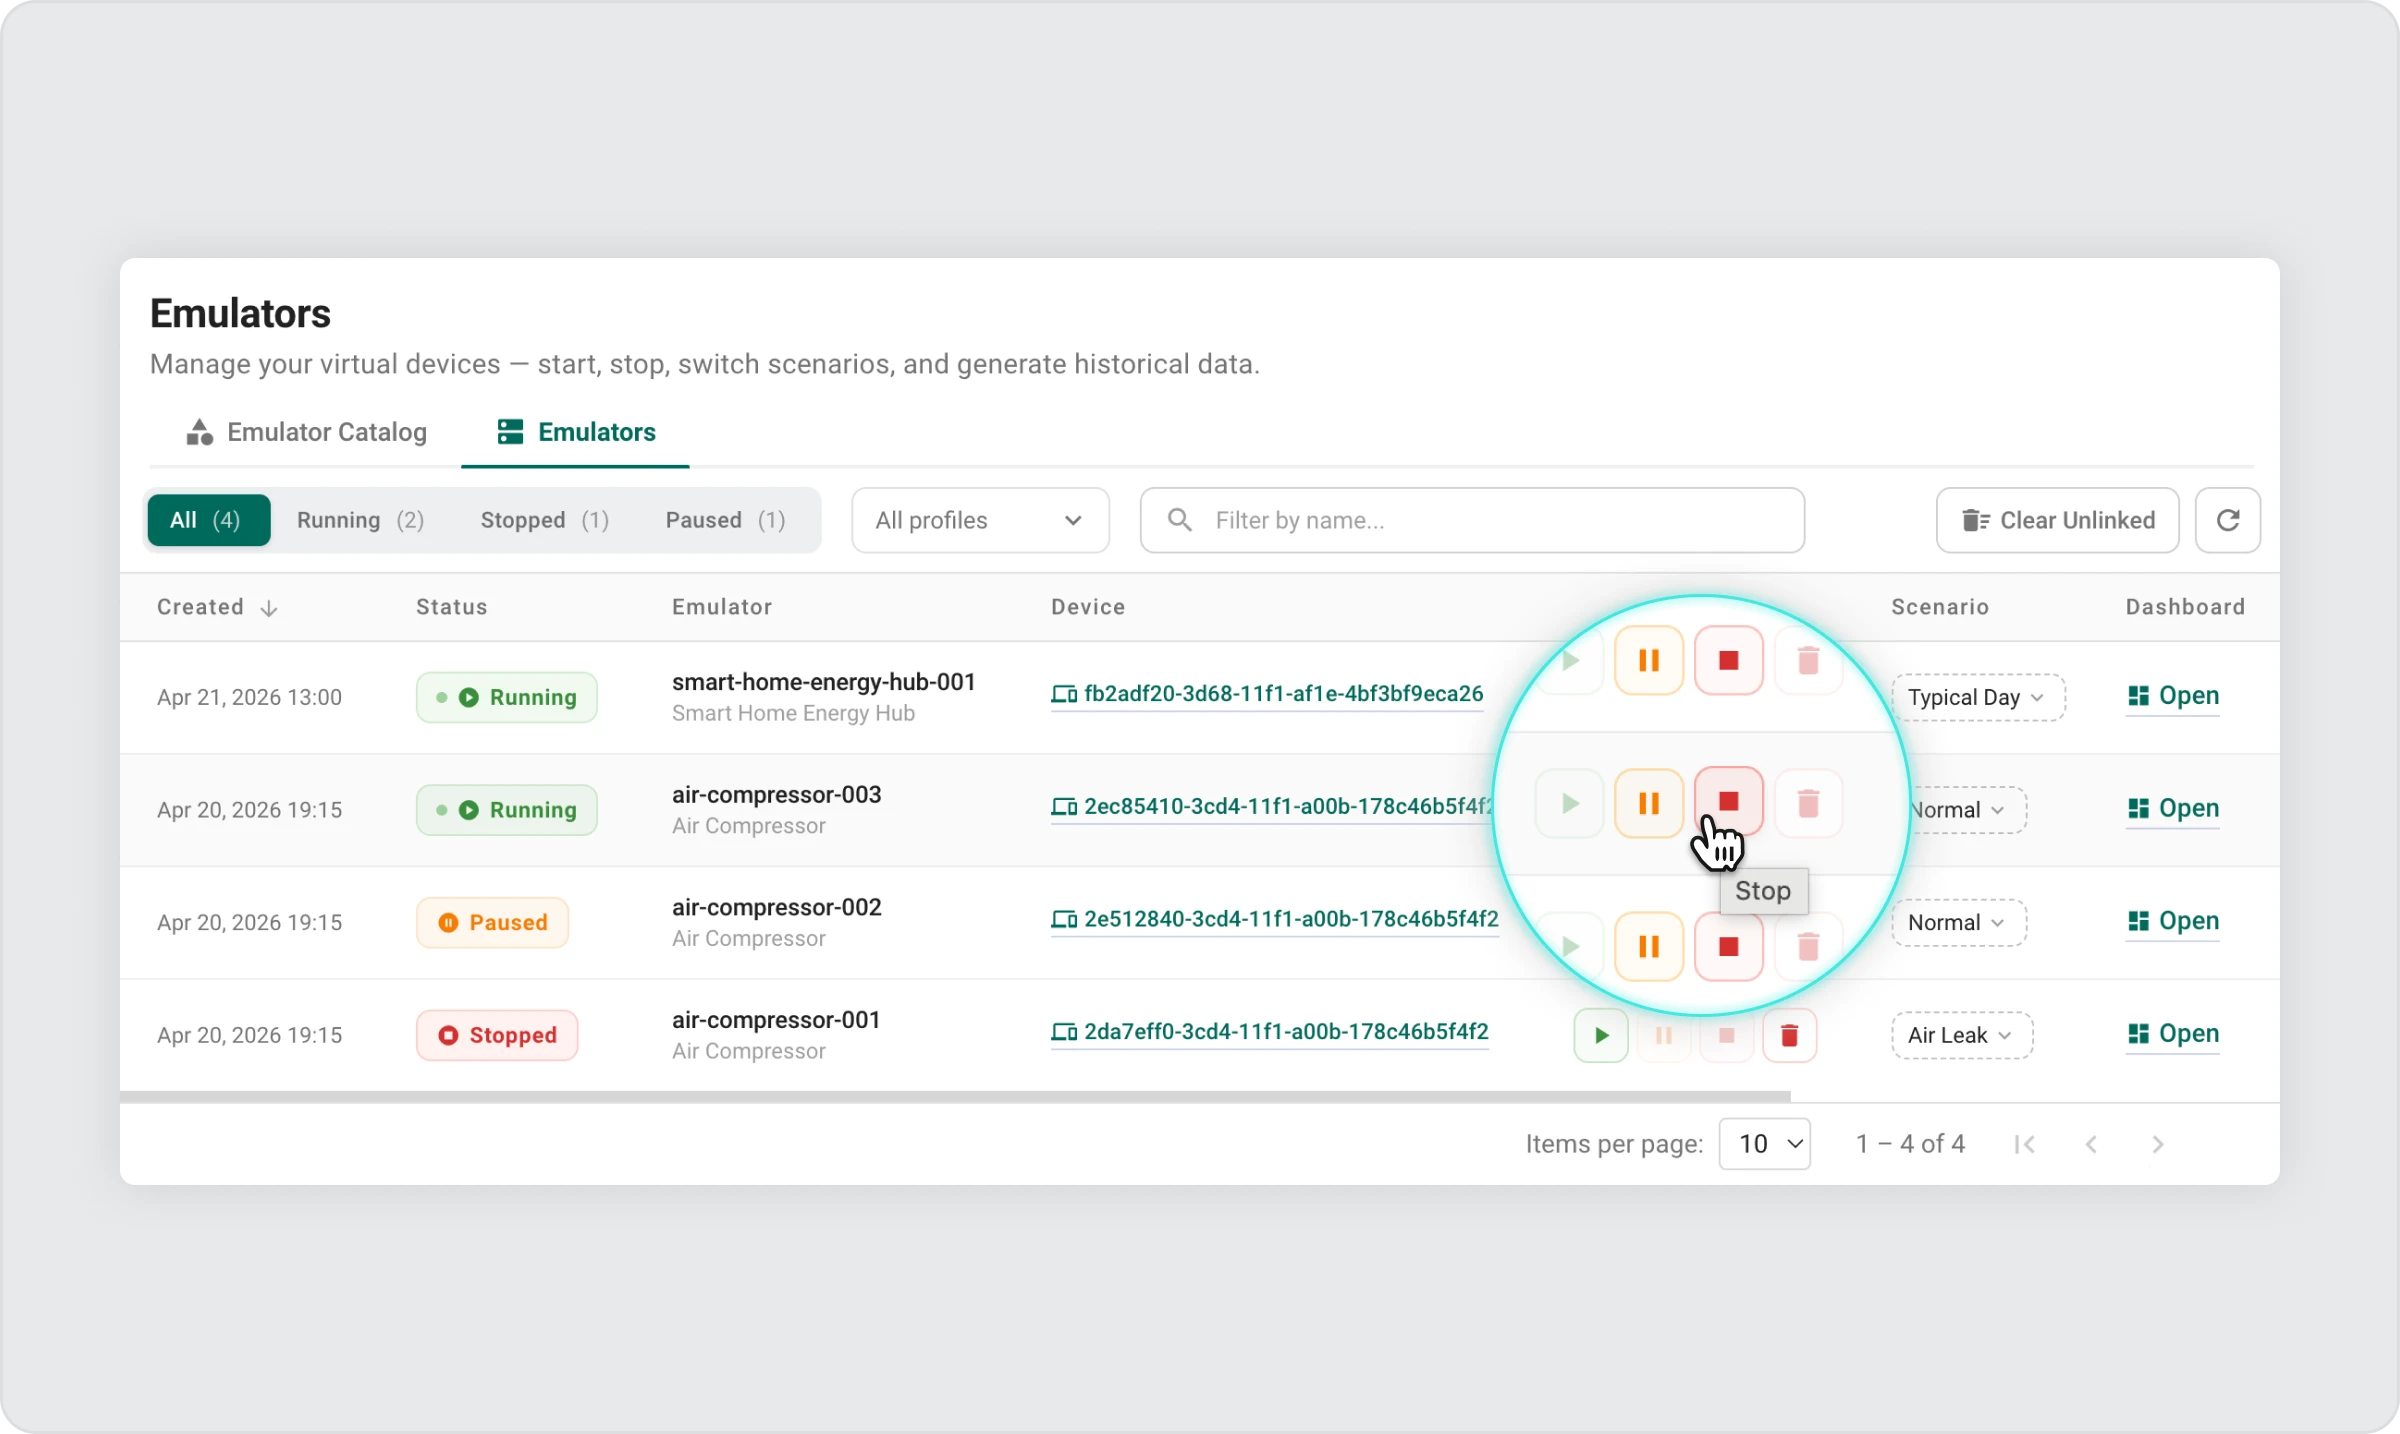
Paused devices are meant for temporary interruptions, while stopped devices are fully inactive and require a manual restart.
Deleting a Device
When you no longer need an emulator, you can delete it from the Emulators List.
Note that deleting an emulator removes it from the list, but some associated ThingsBoard resources (such as the device record itself) may remain in your account and need to be cleaned up manually from the ThingsBoard Devices section.
Changing the Telemetry Rate
You can adjust how often the device sends data at any point — no restart needed.
| Use Case | Recommended Interval |
| Live demonstration | 1–5 seconds |
| Active monitoring test | 10–30 seconds |
| Long-running background simulation | 1–10 minutes |
To change the telemetry rate:
- Open the device dashboard and go to the Emulator Tab.
- Locate the telemetry interval setting.
- Enter the new interval (for example, 5 seconds for a fast demo, or 60 seconds for a background simulation).
- Confirm the change.
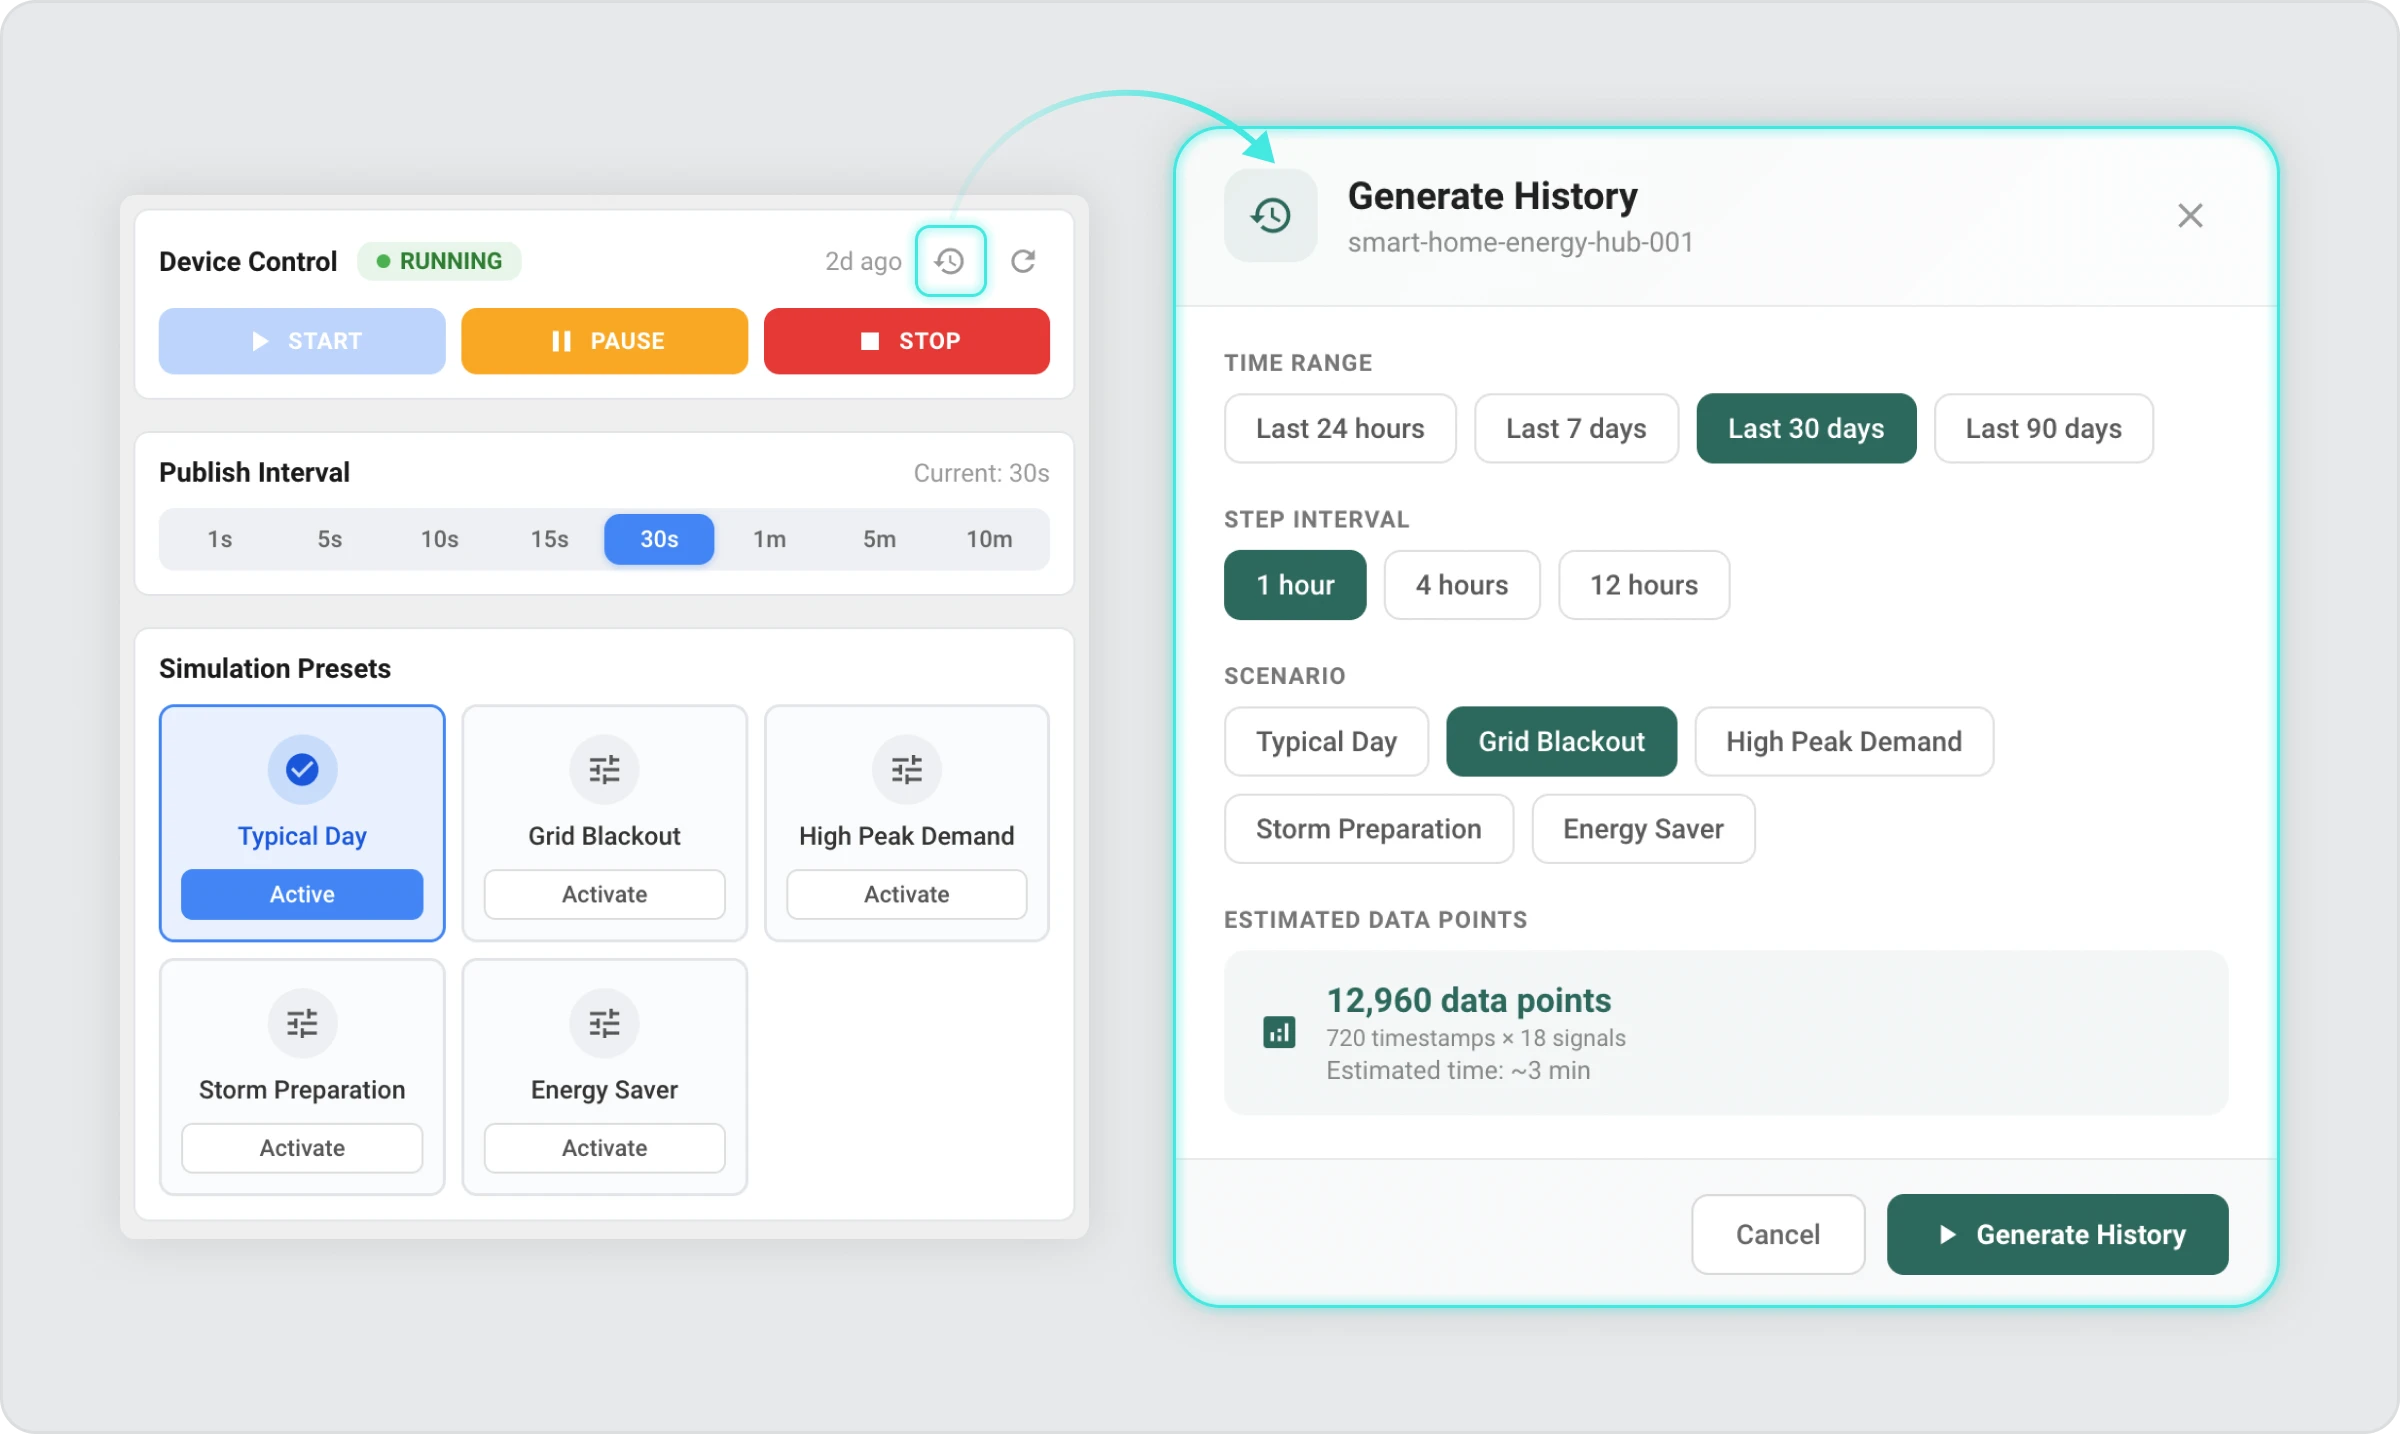
Generating Historical Data
By default, a brand-new virtual device has no history — its charts start from the moment you created it.
The Generate Historical Data feature lets you instantly fill a selected time range with realistic simulated data.
This is particularly useful for:
- Preparing demonstrations or presentations
- Onboarding training sessions where you want participants to see trends immediately
- Testing how dashboards behave with a full data set
How to Generate Historical Data?
- Open the device dashboard
- Find Generate History by clicking on the Emulator Tab.
- Set the date range for the historical period
- Choose which scenario to simulate for that period
- Confirm the request by clicking “Generate History”
The system generates data in the background. For large date ranges, this may take a few minutes — you can keep using the dashboard while it runs.
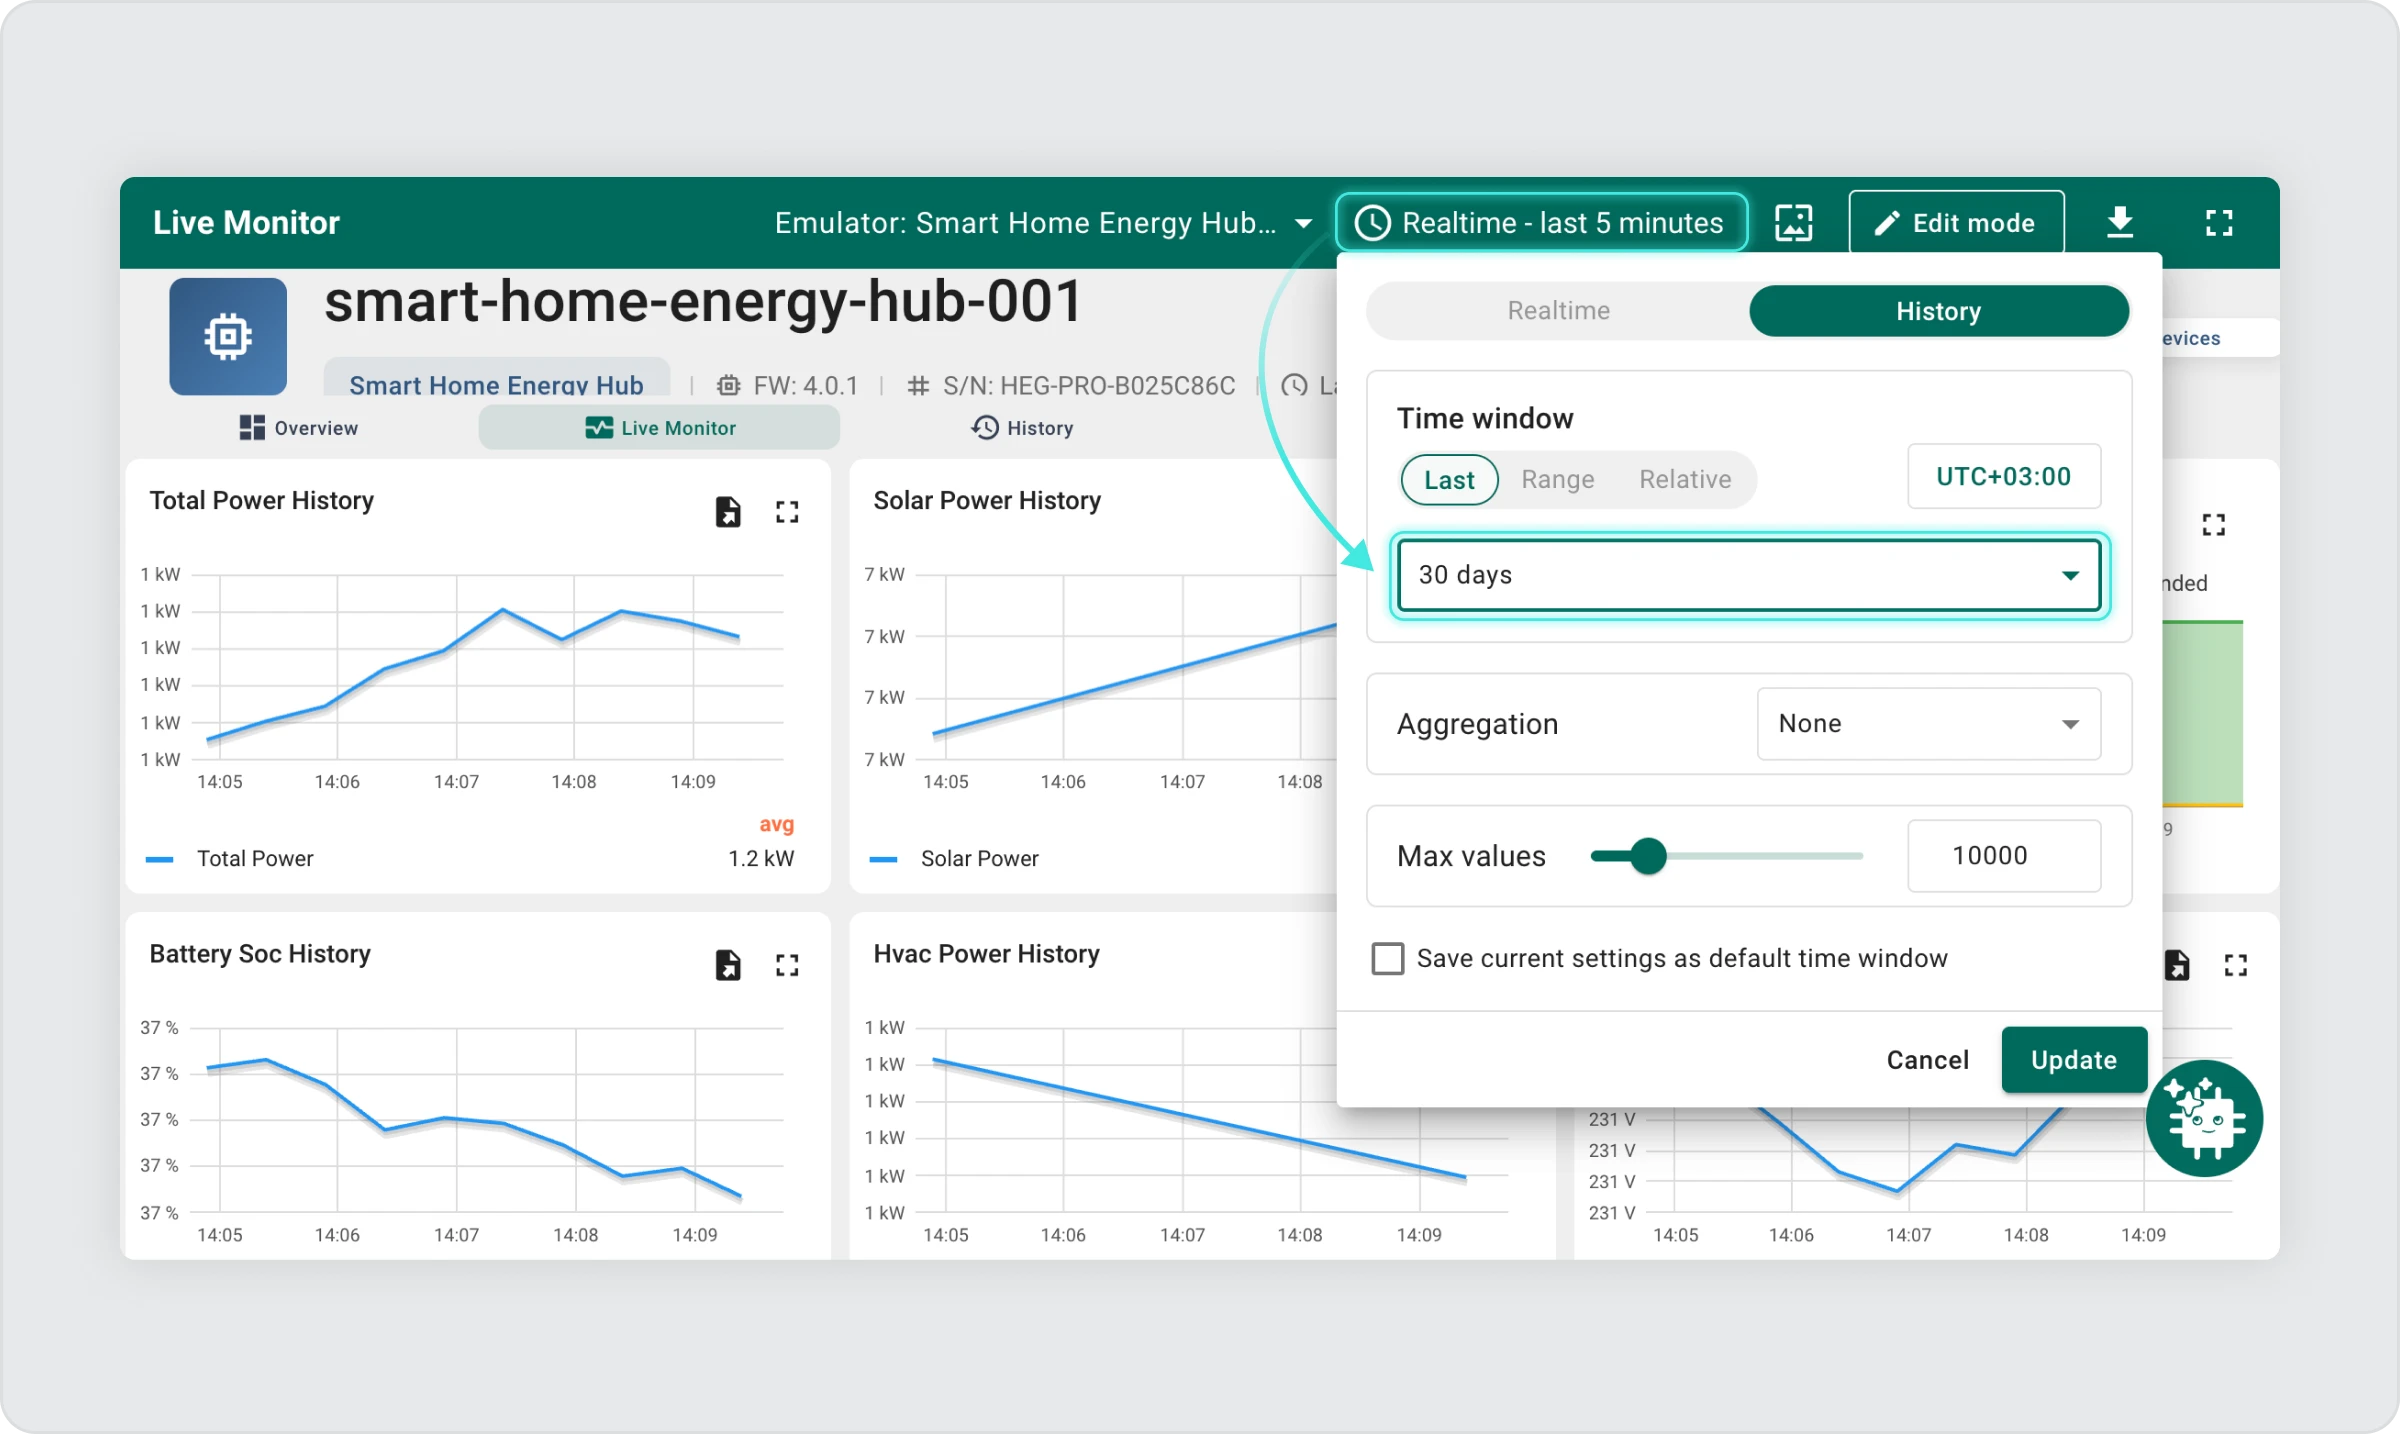
Important step that’s easy to miss:
After the generation completes, your dashboard will likely still be showing the Realtime view (e.g., the last 5 minutes).
To actually see the historical data, click the time window selector at the top of the dashboard and change it to a History interval that covers the date range you selected.
Otherwise, the charts will appear empty even though the data is there.
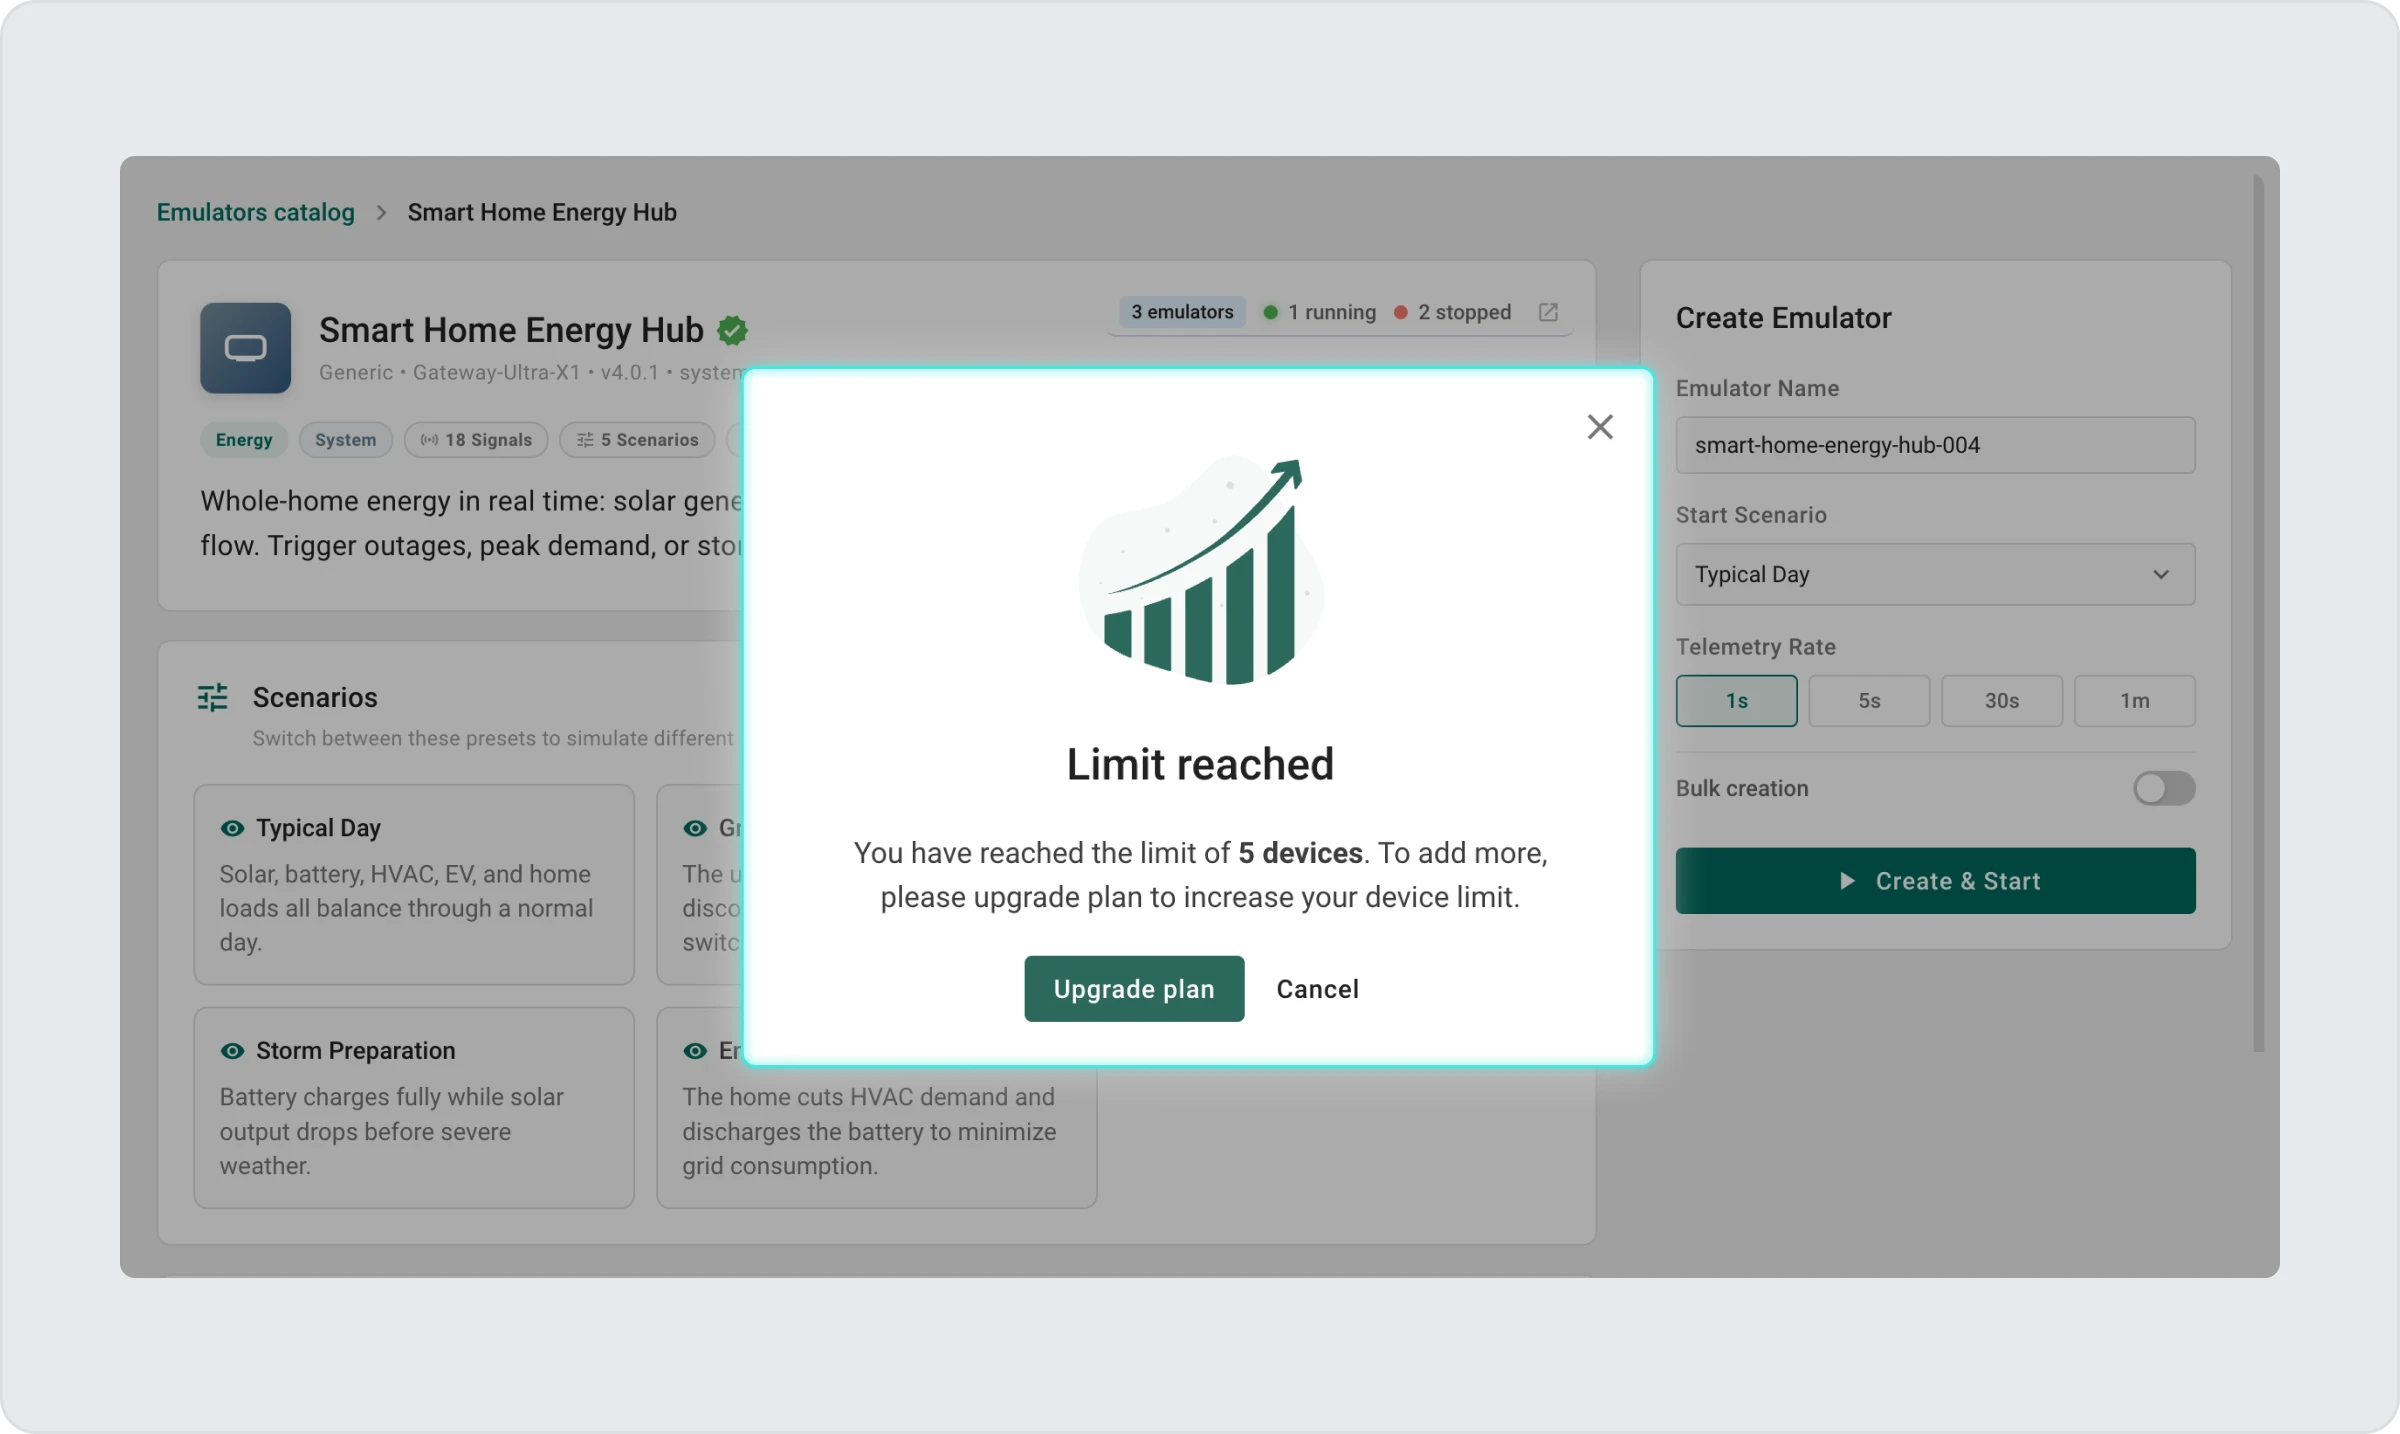
Understanding Limits
The emulator works within your ThingsBoard subscription limits. Here is what to be aware of:
- Device limit — Each virtual device counts toward your account’s maximum device count. If you hit the limit, new emulators cannot be created until you delete unused ones or upgrade your plan.
- Tenant emulator limit — There is also a cap on the total number of emulators per account, set by your administrator.
- Data-point quota — Every telemetry reading and every historical data point generated counts toward your plan’s data quota. If the quota runs out, live telemetry may stop and history generation will fail.
- Automatic pausing — If your account hits its global device or data-point limit while devices are running, the emulator will automatically pause all running emulators. You will see their status change to Paused. To resume, resolve the underlying limit issue first (delete unused devices or upgrade), then manually restart each emulator you need.
Quick Troubleshooting
1. Dashboard shows no data after creating a device
Wait up to 10 seconds and refresh. Check that the emulator status is Running. If it shows Paused, start it manually.
2. Bulk creation stopped before completing
Your device limit was reached. Delete unused devices and retry with a smaller batch.
3. Cannot set a fast telemetry rate during bulk creation
Bulk creation requires a minimum interval of 30 seconds. Increase it and retry.
4. Historical data generation did not complete
Your data-point quota may be exhausted. Try a shorter date range, or reduce the telemetry rate on other running emulators to conserve quota.
5. Emulators were automatically paused
A global account limit was reached. Resolve the limit first, then resume emulators manually.
6. I deleted an emulator but its device still appears in ThingsBoard
This is expected. Deleting an emulator removes it from the Emulators List. The underlying device record in ThingsBoard may need to be removed manually from the Devices section.
Final Thoughts
The ThingsBoard Device Emulator removes one of the biggest barriers to getting started with IoT platform evaluation and development: the need for physical hardware. In a few clicks, you have a live device, a real dashboard, and a continuous stream of data — ready to explore, test, demonstrate, or learn from.
Whether you are a developer validating a new rule chain, a sales engineer preparing a demo, or a team lead evaluating whether ThingsBoard fits your organization’s needs, the emulator gives you a complete, risk-free environment to work in from day one.
The best way to understand it is to try it. Open the Device Emulator, create your first emulator, and switch a scenario to see how instantly everything changes.